Nifty 50 slips below 24,000 as crude spikes, volatility rises
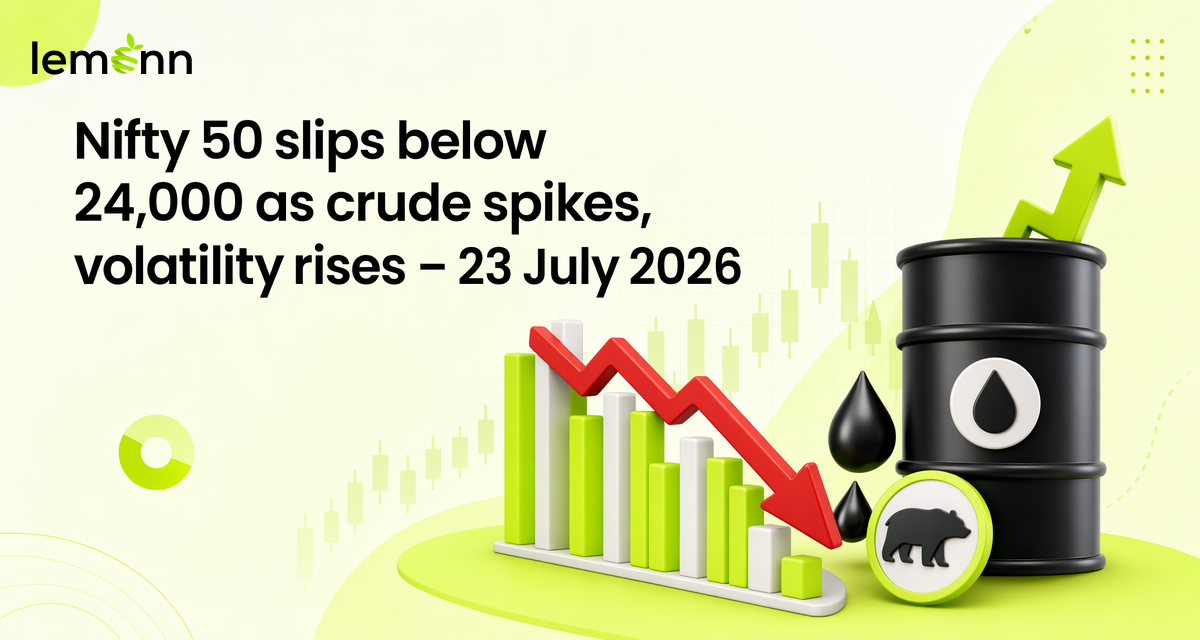
Indian equities extended losses for a fourth straight session on Thursday, with the Nifty 50 closing around 23,839 and the Sensex near 76,255, as Brent crude climbed above $96 a barrel amid escalating Iran US tensions.
Higher energy prices, persistent foreign institutional selling and weakness in banking and broader market indices kept risk appetite subdued, even as select IT and defensive stocks offered limited support.
Market overview
| Index | 23 Jul 2026 Close | Move & % Change | Comments |
|---|---|---|---|
| Sensex | approx. 76,255 | -500 pts (-0.65%) | Fourth day of declines, dragged by banks and Reliance. |
| Nifty 50 | approx. 23,839 | -157 pts (-0.65%) | Slipped below 24,000, trades in short term consolidation range. |
| Bank Nifty | approx. 56,630 | -497 pts (-0.87%) | Underperformed, closed below 20 day EMA, downside momentum rising. |
| Nifty Midcap 100 | approx. lower 0.3% | down 0.3% | Broader weakness signalled cautious risk appetite. |
| Nifty Smallcap 100 | approx. lower 0.3% | down 0.3% | Smallcaps extended declines amid volatility. |
- Indian market logged a fourth consecutive negative session.
- Selling intensified after indices broke below short term moving averages.
- Broader market decline showed risk off mood beyond frontline stocks.
Key movers
Top gainers
| Stock | Sector | Notable Factor |
|---|---|---|
| Eternal | Diversified | Rose about 2 to 3%, only clear Sensex constituent gainer. |
| TCS | IT services | Gained around 1.7%, supported by global tech spending optimism. |
| M&M | Auto | Added nearly 1.6%, bucked broader weakness. |
| HCL Tech | IT services | Advanced about 0.8%, tracking strength in global technology names. |
| Kotak Bank | Private bank | Edged up around 0.6%, selective buying despite sector pressure. |
- Defensive names ITC and Hindustan Unilever posted modest gains.
- IT stocks benefited from upbeat capex commentary by major US tech firms.
Top losers
| Stock | Sector | Notable Factor |
|---|---|---|
| Adani Ports | Ports & logistics | Fell about 2.4%, among top Sensex laggards. |
| Bajaj Finance | NBFC | Declined nearly 1.9%, weighed on financials. |
| IndiGo | Aviation | Dropped around 1.9%, vulnerable to higher fuel costs. |
| Reliance Industries | Energy & telecom | Lost about 1.4%, pressured by crude driven sentiment. |
| Axis Bank | Private bank | Shed roughly 1.3%, part of broader bank selling. |
| SBI | PSU bank | Fell about 1.2%, extended recent weakness in lenders. |
| Infosys | IT services | Down near 1%, despite sector resilience elsewhere. |
| Asian Paints | Consumer | Declined about 0.9%, sensitive to input cost worries. |
- Heavyweights HDFC Bank, NTPC and Power Grid also traded lower.
- Declines in index majors amplified the headline index fall.
Sectoral action
| Sector/Index | Direction (approx.) | Key Drivers |
|---|---|---|
| Nifty Bank / Bank Nifty | down 0.9% | Closed below 20 day EMA, MACD and RSI signal rising downside momentum. |
| Nifty Oil & Gas | down 1% | Higher crude prices and supply risk weighed on energy names. |
| Nifty Pharma | down 1% | Sector opened lower, tracking risk off sentiment. |
| FMCG | mixed to slightly up | Select stocks attracted defensive buying amid volatility. |
| Midcap & Smallcap indices | down 0.3% | Broader market weakness as investors cut risk exposure. |
- NSE breadth showed around 1,456 declines versus 695 advances.
- Most sectoral indices ended in the red, showing broad based selling.
Technical outlook
- Nifty 50 has been consolidating between 23,785: 24,531 since mid June.
- Index now trades below key moving averages, short term bias remains cautious.
- Immediate Nifty resistance seen at 24,070: 24,100 (20 day EMA zone).
- Additional resistance zones at 24,200: 24,250 and 24,150.
- Nifty support identified at 23,800: 23,750, with extension risk to 23,650.
- Option data suggests broader Nifty trading band 23,500: 24,500.
- “A decisive and sustained breach below this support zone could trigger an extension of the ongoing weakness and lead to further downside in the index.”, Sudeep Shah, Head Technical and Derivatives Research, SBI Securities.
- Sensex slipped below its 20 day SMA around 77,000, showing near term weakness.
- Analysts see potential Sensex downside towards 76,000, then 75,700: 75,500.
- On the upside, a move above 77,000 could open 77,300: 77,500.
- Bank Nifty closed below its 20 day EMA for the first time since early July.
- Immediate Bank Nifty support lies at 56,700: 56,600, then 56,300: 56,000.
- Resistance is placed at 57,500: 57,600, with another cap near 57,800.
Global cues
| Market/Asset | Movement | Notes |
|---|---|---|
| Brent crude | +2.3%, around $96.20 | Hit six week high after US strikes on Iran and Houthi attacks on Saudi tankers. |
| WTI crude | above $88 | Followed Brent higher, reinforcing energy cost concerns. |
| South Korea KOSPI | +3.15% | Rallied on US tech capex boost. |
| Nikkei 225, Hang Seng | up | Advanced despite Middle East tensions. |
| Shanghai Composite | down | Traded lower, diverging from regional peers. |
| US equities | down | Closed in negative territory on previous session. |
| Rupee vs USD | near 96.52 | Traded steady, with expectations of RBI support offsetting oil impact. |
- Yemen’s Houthi rebels reportedly targeted Saudi oil tankers, raising supply disruption fears.
- US military completed a 12th successive night of strikes on Iranian targets.
- “India’s vulnerability to high oil price is once again becoming a macro concern.”, V K Vijayakumar, Chief Investment Strategist, Geojit Investments.
Flows and volatility
| Statistic | Value/Change | Context |
|---|---|---|
| FII equity flows (22 Jul) | ₹819.20 crore selling | Foreign investors resumed net selling after a brief pause. |
| Market breadth (NSE) | 1,456 declines, 695 advances | Reflects broad based risk reduction across segments. |
- Persistent FII outflows added to pressure on indices and the rupee.
- Analysts expect markets to stay range bound with a cautious undertone.
- “In my view, the Indian equity market is likely to remain range bound with a mildly cautious undertone in the near term.”, Vipin Dixena, Market Analyst.
Smallcap volatility backdrop
- Data on Nifty Smallcap 250 TRI show frequent sharp intra year drawdowns.
- In 12 of the past 20 years, the index saw over 20% peak to trough falls.
- Comparable Nifty 50 TRI drawdowns above 20% occurred in only 4 years.
- Historical smallcap corrections show higher volatility versus large caps.
- A ₹1 lakh lump sum in Nifty Smallcap 250 TRI before the 2008 crisis grew to ₹4.3 lakh by March 2026.
- The same amount invested at the 2008 bottom reached ₹17.7 lakh over that period.
- Median 10 year SIP returns in the index were around 16% annually.
- These outcomes show the role of entry timing in one time investments.
- Systematic investing has historically reduced dependence on precise market timing.
Frequently Asked Questions
Why did Sensex and Nifty fall for a fourth straight session?
Indices fell mainly because Brent crude rose above $96 per barrel on escalating Iran US tensions, persistent foreign institutional selling, and weakness in banking and broader market stocks, which together dampened risk appetite.
What are the key support and resistance levels for Nifty 50 now?
Analysts see Nifty support at 23,800 to 23,750, with broader support near 23,650, while immediate resistance lies around 24,070 to 24,100, then 24,200 to 24,250, within an overall trading band of 23,500 to 24,500.
How are higher crude oil prices impacting Indian equities?
Higher crude prices raise concerns over inflation, corporate margins and India’s import bill, pressure energy sensitive sectors such as oil and aviation, weigh on the rupee, and are prompting foreign investors and domestic traders to cut risk exposure.
Disclaimer
The stocks mentioned in this article are not recommendations. Please conduct your own research and due diligence before investing. Investment in securities market are subject to market risks, read all the related documents carefully before investing. Please read the Risk Disclosure documents carefully before investing in Equity Shares, Derivatives, Mutual fund, and/or other instruments traded on the Stock Exchanges. As investments are subject to market risks and price fluctuation risk, there is no assurance or guarantee that the investment objectives shall be achieved. Lemonn (Formerly known as NU Investors Technologies Pvt. Ltd) do not guarantee any assured returns on any investments. Past performance of securities/instruments is not indicative of their future performance.