
Best Indicators for Intraday Trading India: RSI, MACD, Supertrend, VWAP
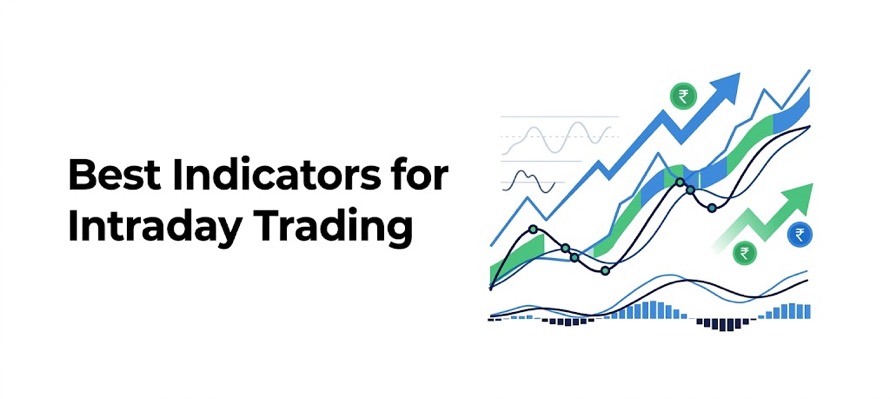
Technical indicators for intraday trading identify trends, momentum, and entry/exit points. The key rule: use 2 to 3 complementary indicators: one trend indicator, one momentum indicator, and one volume indicator. Never use 5+ indicators simultaneously.
Top 5 Indicators for Intraday Trading Compared
| Indicator | Type | Best Timeframe | What It Provides |
|---|---|---|---|
| RSI (14) | Momentum oscillator (0-100) | 15-min, 1-hour | Overbought/oversold signals, divergence |
| MACD (12-26-9) | Trend + momentum | 15-min, 1-hour | Trend direction, signal line crossovers |
| Supertrend (10,3) | Trend following | 5-min, 15-min | Clear green/red buy-sell signal |
| VWAP | Volume-weighted price | 5-min, 15-min | Institutional fair value, intraday bias |
| Bollinger Bands (20,2) | Volatility | 15-min | Squeeze breakouts, mean reversion plays |
RSI for Intraday Trading
RSI measures momentum on a scale of 0 to 100. Values above 70 signal overbought conditions; below 30 signals oversold. For intraday on the 15-minute chart, use RSI to avoid entering overbought long trades or oversold short trades. RSI divergence, where price makes a new high but RSI makes a lower high, is a powerful warning signal.
“Start investing with confidence! Explore
0 demat account
and grow your wealth.”
MACD for Intraday Trading
MACD (12-26-9) combines a fast EMA (12), slow EMA (26), and signal line (9-period EMA of MACD). When the MACD line crosses above the signal line, it is a bullish signal. When it crosses below, it is bearish. The histogram shows momentum strength; expanding bars mean strong momentum, shrinking bars mean the move is weakening.
Supertrend: The Clearest Intraday Indicator
Supertrend is a trend-following indicator based on ATR (Average True Range). When it flips green (line below price), it signals an uptrend: hold or go long. When it flips red (line above price), it signals a downtrend; hold short or exit longs. Settings: period 10, multiplier 3 is the most widely used by Indian traders. It gives exactly one signal per side, no ambiguity.
VWAP: The Institutional Benchmark
VWAP (Volume Weighted Average Price) is the most important intraday indicator for institutional activity. Institutions benchmark their executions to VWAP; most institutional buy orders are placed when price is below VWAP and sell orders when above.
- Price above VWAP = bullish intraday bias: prefer long trades
- Price below VWAP = bearish intraday bias: prefer short trades
- Price at VWAP = decision point: watch for direction before entering
The Power Combo: Supertrend + RSI + VWAP
- Use Supertrend on the 15-minute chart to determine trend direction (green = long only, red = short only)
- Only take long trades when price is above VWAP (VWAP confirms institutional bullish bias)
- Use RSI to confirm entry: enter longs when RSI is between 40 and 60 (not already overbought)
- Place stop-loss below the most recent Supertrend flip level
- Exit when Supertrend flips color or RSI reaches 70+ (overbought)
FAQs
Which is the single best indicator for intraday?
VWAP is considered the most important single intraday indicator. Supertrend is the most beginner-friendly. Combining both gives excellent results.
What timeframe should I use for intraday charts?
Use 15-minute charts for signal identification and 5-minute charts for precise entry/exit timing. Do not use 1-minute charts; too much noise.
Do indicators work on F&O or only on cash stocks?
They work on both. Most intraday traders apply the same indicators to Nifty and BankNifty futures charts.
What is the best indicator combination for beginners?
Supertrend (10,3) for trend direction + VWAP for intraday bias. Two complementary indicators. Simple and effective.
How do I add indicators on Lemonn?
Tap on any stock chart, then tap the Indicators icon at the top right. Search for RSI, MACD, Supertrend, or VWAP and add them to your chart.
Disclaimer
The stocks mentioned in this article are not recommendations. Please conduct your own research and due diligence before investing. Investment in securities market are subject to market risks, read all the related documents carefully before investing. Please read the Risk Disclosure documents carefully before investing in Equity Shares, Derivatives, Mutual fund, and/or other instruments traded on the Stock Exchanges. As investments are subject to market risks and price fluctuation risk, there is no assurance or guarantee that the investment objectives shall be achieved. Lemonn (Formerly known as NU Investors Technologies Pvt. Ltd) do not guarantee any assured returns on any investments. Past performance of securities/instruments is not indicative of their future performance.
Related Posts

Download Lemonn
Download my app for share market trading, ipo investment, trading account, and all your investment needs.



