
Moving Averages Trading Strategy for NSE Stocks: From Theory to Practice in 2026
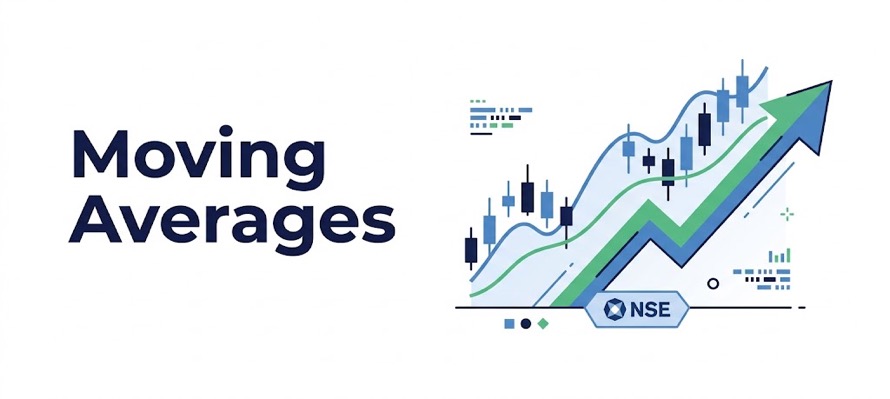
Why Moving Averages Remain Relevant in 2026
Moving averages are used by so many market participants: retail, institutional, algorithmic; that they become self-fulfilling at key levels. The 200 SMA on daily charts of Nifty, Bank Nifty, and major large-cap stocks is watched by millions. This widespread attention makes it a significant support/resistance level.
Types of Moving Averages
| Type | Calculation | Characteristic | Best Use |
|---|---|---|---|
| SMA (Simple) | Equal weight to all periods | Slower, smoother | Long-term trend (200 SMA) |
| EMA (Exponential) | More weight to recent prices | Faster, more responsive | Short-term momentum |
| WMA (Weighted) | Linear weight to periods | Between SMA and EMA | Less common |
| VWMA (Volume-Weighted) | Price weighted by volume | Reflects actual market activity | Intraday analysis |
“Start investing with confidence! Explore
share market
and grow your wealth.”
The Golden Cross and Death Cross
Golden Cross: 50 SMA crosses above 200 SMA: long-term bullish signal. Death Cross: 50 SMA crosses below 200 SMA: long-term bearish signal. These signals are lagging (they confirm trends already in place) but have historically preceded extended bull/bear periods in Nifty.
| Signal | Condition | Historical Implication for Nifty |
|---|---|---|
| Golden Cross | 50 SMA > 200 SMA | Typically bullish for 6–18 months |
| Death Cross | 50 SMA < 200 SMA | Risk-off period, defensive positioning |
| Price vs 200 SMA | Price > 200 SMA | Above = participate in market; below = caution |
Moving Average as Dynamic Support and Resistance
In strong uptrends, the 20 EMA often acts as dynamic support; price touches it on dips and bounces. The 50 SMA acts as medium-term support. This creates a simple strategy: in an uptrend (price above 200 SMA), buy when price pulls back to touch the 20 or 50 EMA and shows reversal candles.
EMA Ribbon Strategy
An EMA ribbon uses multiple EMAs simultaneously (e.g., 5, 10, 20, 50 EMAs). When all EMAs are aligned from fastest to slowest below price and fanning out, it signals a strong trend. When they start converging, trend momentum is weakening. This visual tool helps identify trend health without specific crossover signals.
Multi-Timeframe Moving Average Confluence
The most reliable moving average signals occur when multiple timeframes align. Example: stock is above 200 SMA on weekly chart, above 50 SMA on daily chart, and pulls back to touch 20 EMA on daily. This triple-timeframe confluence (long-term trend + medium-term trend + short-term entry) provides high-probability setups.
Practical Moving Average Setup for Lemonn Charts
- Daily chart: 20 EMA (trend guidance), 50 SMA (medium support), 200 SMA (bull/bear filter)
- Weekly chart: 30 SMA (widely watched), 50 SMA (major support/resistance)
- 60-minute chart: 9 EMA, 21 EMA for intraday trend identification
- 5-minute chart: 9 EMA, VWAP for intraday momentum
Limitations of Moving Averages
- Lagging indicator: confirms trends after they begin, misses early entry
- Whipsaws in ranging markets: frequent crossover signals that fail
- Work best in trending markets: combine with ADX to confirm trend strength before trading MAs
Disclaimer
The stocks mentioned in this article are not recommendations. Please conduct your own research and due diligence before investing. Investment in securities market are subject to market risks, read all the related documents carefully before investing. Please read the Risk Disclosure documents carefully before investing in Equity Shares, Derivatives, Mutual fund, and/or other instruments traded on the Stock Exchanges. As investments are subject to market risks and price fluctuation risk, there is no assurance or guarantee that the investment objectives shall be achieved. Lemonn (Formerly known as NU Investors Technologies Pvt. Ltd) do not guarantee any assured returns on any investments. Past performance of securities/instruments is not indicative of their future performance.
Related Posts


Download Lemonn
Download my trading app for SIP, demat account services—get a free demat account with our demat apps.



