
Chart Patterns That Work in Indian Stock Markets: A Data-Driven 2026 Guide
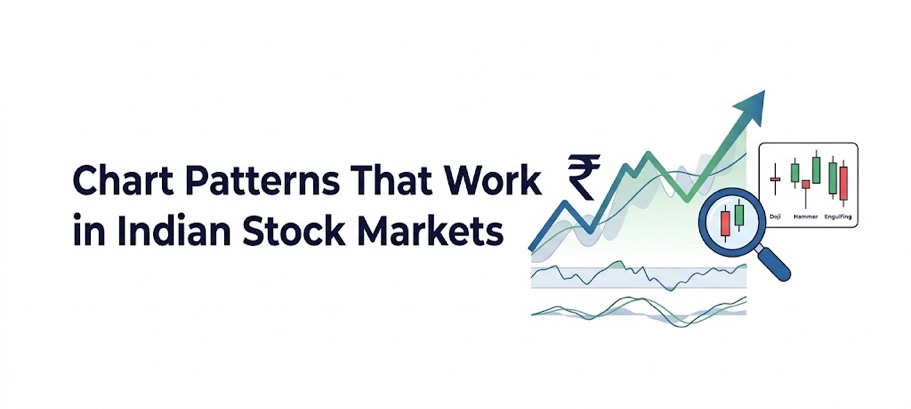
Chart Patterns: Signal vs Noise
Not all chart patterns have equal reliability. Academic research (Bulkowski’s Encyclopedia of Chart Patterns) has measured continuation and reversal rates across thousands of patterns. We focus on the highest-reliability patterns relevant to Indian equity markets.
Reversal Patterns: When Trends Change
“Start investing with confidence! Explore
share market
and grow your wealth.”
Head and Shoulders (H&S)
The H&S is one of the most reliable bearish reversal patterns. It forms after an uptrend with three peaks: a middle peak (head) higher than the two flanking peaks (shoulders). The neckline connects the troughs between peaks. A close below the neckline confirms the reversal. Target: neckline minus the height of the head.
Double Top and Double Bottom
Double top: price fails to break a resistance level twice, then breaks below support. Double bottom: price fails to break support twice, then breaks above resistance. Both are high-reliability patterns with clear invalidation levels (above the twin peaks/troughs).
| Pattern | Type | Reliability | Target Method |
|---|---|---|---|
| Head and Shoulders | Reversal (bearish) | High (~83%) | Height of head from neckline |
| Inverse H&S | Reversal (bullish) | High (~89%) | Height of head from neckline |
| Double Top | Reversal (bearish) | Moderate (~65%) | Height of top from neckline |
| Double Bottom | Reversal (bullish) | Moderate (~65%) | Height of base to target |
Continuation Patterns: Trend Pauses
Bull Flag
After a sharp move up (flagpole), price consolidates in a tight downward channel (the flag). Breakout above the upper channel line resumes the uptrend. Target: add flagpole height to breakout point. Bull flags are very common in momentum stocks on NSE.
Ascending Triangle
Flat resistance at the top, rising support (higher lows). Pressure builds as buyers become more aggressive on each dip. Resolution is typically a bullish breakout above flat resistance on volume. Very reliable in bull market conditions.
Cup and Handle
A U-shaped price consolidation (cup) followed by a small pullback (handle) before a breakout. This is a longer-term pattern (weeks to months) often seen in growth stocks. Target: depth of cup added to breakout.
| Pattern | Type | Typical Duration | Best Timeframe |
|---|---|---|---|
| Bull Flag | Continuation (bullish) | Days–2 weeks | Daily, 60-min |
| Bear Flag | Continuation (bearish) | Days–2 weeks | Daily, 60-min |
| Ascending Triangle | Continuation (bullish) | Weeks–months | Daily, weekly |
| Cup and Handle | Continuation (bullish) | Months | Weekly |
| Symmetrical Triangle | Neutral breakout | Weeks | Daily |
How to Trade Chart Patterns: Practical Rules
- Identify the pattern on a clean chart, don’t force it if unclear
- Mark the key level: neckline (reversals) or resistance line (continuations)
- Wait for confirmed close above/below the key level, don’t anticipate
- Check volume: breakout should have above-average volume
- Calculate target using pattern’s measurement rules
- Set stop loss at pattern invalidation point (below neckline for H&S, etc.)
Disclaimer
The stocks mentioned in this article are not recommendations. Please conduct your own research and due diligence before investing. Investment in securities market are subject to market risks, read all the related documents carefully before investing. Please read the Risk Disclosure documents carefully before investing in Equity Shares, Derivatives, Mutual fund, and/or other instruments traded on the Stock Exchanges. As investments are subject to market risks and price fluctuation risk, there is no assurance or guarantee that the investment objectives shall be achieved. Lemonn (Formerly known as NU Investors Technologies Pvt. Ltd) do not guarantee any assured returns on any investments. Past performance of securities/instruments is not indicative of their future performance.
Related Posts


Download Lemonn
Download my trading app for SIP, demat account services—get a free demat account with our demat apps.



