
Support and Resistance Trading Strategy for Indian Stocks: 2026 Guide
Why Support and Resistance is the Core of Technical Analysis
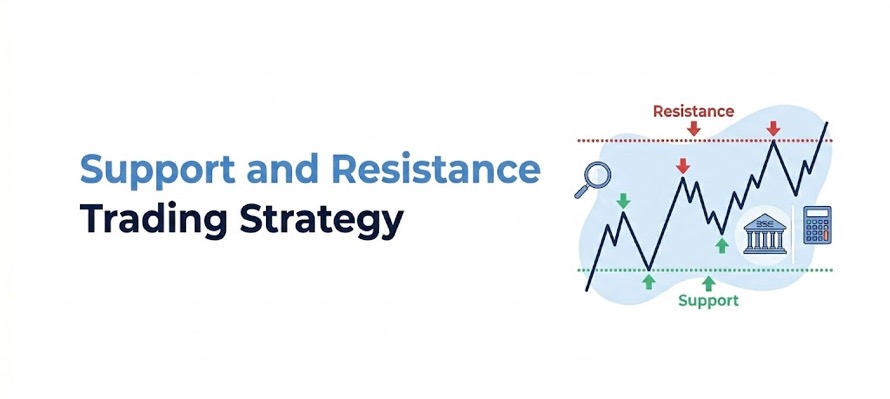
Support and resistance levels represent areas of supply and demand imbalance in the market. They are not lines, they are zones. More people have traded at these levels historically, creating price memory. These zones attract price repeatedly, making them powerful for planning entries, exits, and stop losses.
How to Draw Support and Resistance
- Switch to weekly chart first; identify major swing highs and lows
- Draw horizontal lines at levels where price reversed multiple times
- Switch to daily chart; add medium-term levels
- Note: zones, not exact prices; allow 0.5–1% buffer around each level
- Mark psychological round numbers (Nifty 22,000, 23,000, etc.) as support/resistance
“Start investing with confidence! Explore
share market
and grow your wealth.”
Types of Support and Resistance
| Type | Description | Examples |
|---|---|---|
| Historical swing highs/lows | Previous major turning points | Nifty 2024 high, 2020 COVID low |
| Round numbers | Psychological price levels | 22,000, 23,500 on Nifty |
| Moving averages | Dynamic support/resistance | 200 SMA as floor in bull market |
| Gap zones | Price gap areas attract fills | Post-earnings gaps on individual stocks |
| Volume profile POC | High-volume price nodes | From volume profile indicator |
The Breakout Trade Setup
A breakout occurs when price moves through a resistance level on high volume. Well-planned breakout trades offer excellent risk/reward. Key checklist before entering a breakout:
- Price has tested resistance at least 2–3 times previously
- Breakout candle has significantly higher volume than average
- Breakout happens during active market hours (11 AM – 2 PM, not at open/close)
- RSI or MACD showing momentum in breakout direction
- No major news event due immediately (can cause whipsaws)
Role Reversal: The Most Powerful Concept
Once a resistance level is convincingly broken, it becomes the new support. When price later pulls back to test this level from above, it is the highest-probability long entry. This is called role reversal and is one of the most reliable setups in technical analysis.
| Trade Type | Entry | Stop Loss | Target |
|---|---|---|---|
| Breakout long | Close above resistance | Below resistance zone | 1.5x–2x risk-reward |
| Role reversal long | Pullback to old resistance (now support) | Below this level | Prior high |
| Breakdown short | Close below support on volume | Above support zone | 1.5x–2x risk-reward |
| Role reversal short | Bounce to old support (now resistance) | Above this level | Prior low |
Fakeouts: How to Avoid Them
A fakeout (false breakout) is when price briefly moves through a level then reverses sharply. To filter fakeouts: wait for a candle close above (not just a wick), check volume (low volume breakouts are suspect), and avoid entering on the breakout candle itself, wait for a retest.
Disclaimer
The stocks mentioned in this article are not recommendations. Please conduct your own research and due diligence before investing. Investment in securities market are subject to market risks, read all the related documents carefully before investing. Please read the Risk Disclosure documents carefully before investing in Equity Shares, Derivatives, Mutual fund, and/or other instruments traded on the Stock Exchanges. As investments are subject to market risks and price fluctuation risk, there is no assurance or guarantee that the investment objectives shall be achieved. Lemonn (Formerly known as NU Investors Technologies Pvt. Ltd) do not guarantee any assured returns on any investments. Past performance of securities/instruments is not indicative of their future performance.
Related Posts


Download Lemonn
Download my trading app for SIP, demat account services—get a free demat account with our demat apps.


