
How to read candlestick charts for intraday trading
If you have some experience in trading, you would have heard about candlestick charts. Learning to read candlestick patterns in intraday trading is very important as it would help you plan your next trading move.
However, if you are new to this technical analysis tool, it might be a bit challenging for you to understand and analyze market movement by reading candlestick charts. In this blog, we will handhold you on how trading candlestick patterns will help you become a better trader.
What are candlestick charts/graphs?
Candlestick charts are an integral part of intraday trading analysis. However, before you learn how to read candlestick patterns, let’s begin with the basics and learn what candlestick graphs or charts are. A candlestick chart or graph is a useful tool that helps investors and traders understand price action in intraday trading. Traders can decide the opening and closing prices for a specified period of time, including the highs and lows of that particular time by analyzing each candle. The price action study gives valuable insights into the potential market trends and possible reversals.
A bunch of candlestick graphs indicate if a trend will continue or reverse in the upcoming time. Plus, each candlestick formation indicates the most suitable stock buying and selling opportunities in the intraday trading market. Also, the trader’s chosen timeframe decides the duration of the individual candlesticks.
Composition of a candlestick chart
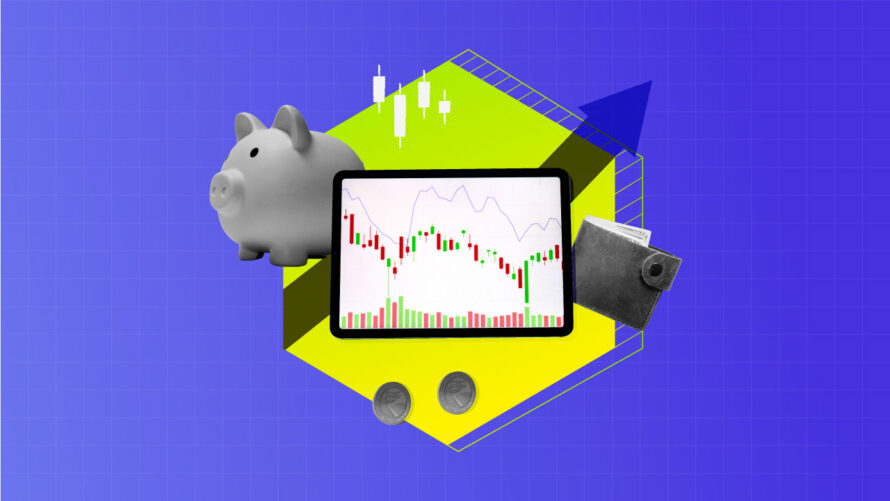
The candlestick chart pattern is very helpful for traders. Investors analyze individual candles to understand the stock market for a specified period. The candlestick chart consists of several individual candles or horizontal bars. A candle has three parts—The Body, Upper Shadow, and Lower Shadow.
The candles can be either green or red and represent a specific time period. An individual candle in this chart indicates data about trades executed within that specific timeframe. There are four points of data that one can get from a single candle in the chart:
- Open- It represents the very first trade executed in a specific time period.
- Close- It represents the last trade executed in a specific time period.
- High- It indicates the highest price of a trade during a specific time period.
- Low- It indicates the lowest price of a trade during a specific time period.
“Start investing with confidence! Explore
share market
and grow your wealth.”
How to analyze candlestick chart
Knowing how to read candlestick patterns is your first step to getting started with the candlestick chart analysis. Each individual candlestick has three parts—-body, head, and tail. The candle body refers to the opening and closing prices of a trade during a specific timeframe. This holds immense significance in candlestick trading. Also, the color of the candle body offers insights into the falling or the rising price of stocks. As a result, traders can easily understand the price range of a stock within a specified timeframe, just by glancing at the candlestick patterns.
Suppose you are studying a candlestick chart pattern for a particular month where each individual candlestick represents a day. If you observe constitutive red candles on the chart, it indicates a falling price trend. On the other hand, vertical lines below and above the candle body refer to wicks and shadows, signaling the highs and lows of the stock trade price. Here are a few insights on how to perform a share market candle chart study or analysis.
- A small wick above a green candlestick suggests that the stock closed near its daily highs.
- Conversely, a small wick above a red candlestick suggests that the stock opened to its daily highs.
- Remember, candlestick patterns represent the daily relationship between the stock’s price highs, lows, opening, and closing. Also, traders can get invaluable insights into the market sentiment and trend direction from the candlestick body length, size of the wick or shadow, as well as the colour of the candlestick. Thus, learning how to read candlestick patterns is essential to analyze your intraday trading options.
Candlestick chart patterns
Trading candlestick chart patterns for intraday trading provides crucial insights for the traders in understanding the market sentiment, evaluating the interplay between supply and demand, greed and fear, bears and bulls, and other market factors. As a trader, you must remember that an individual candlestick offers essential insights on buying and selling opportunities, while locating a candlestick pattern depends on comparing the individual candlestick with its succeeding and preceding candles.
To make the most of these candlestick patterns, you have to understand various candlestick patterns on the candlestick chart. Some of the candlestick patterns are:
Bullish Pattern
Bullish candlestick patterns have a bullish nature which means the continuation of a defined uptrend or a coming uptrend of a specific asset’s price. Here are some of the major bullish candlestick patterns.
Hammer Pattern
This pattern is found at a downward trend’s end and is characterized by an elongated lower wick and a small body. It usually indicates upward price movement even when there is selling pressure due to a significant surge in buying activity. A green candle signifies a bullish market compared to a red candlestick.
Inverse Hammer Pattern
The inverse hammer pattern is one of the most important bullish candlestick patterns. This pattern is usually found at the end of a downward trend. It is characterized by a short body and a long upper wick. It signifies a surge in the buying trend, followed by a selling trend. It indicates that buyers will dominate the market in the near future.
Bullish Engulfing Pattern
The bullish engulfing pattern is composed of two candlesticks. One candlestick is small and red, while the other is green and large. The large green candle encompasses the small red candle. It indicates an upward price movement or a bullish market in spite of a lower opening than the day before.
Piercing Line Pattern
The piercing line pattern is another two-candlestick pattern where a long green candle follows a long red candle. However, the green or second candle’s closing price must be above the midpoint of the red or first candle’s body.
Morning Star Pattern
The Morning Star Pattern is a three-candlestick pattern. It is characterized by a short candle positioned between one long green candle and a long red candle. These candles usually do not overlap each other. This pattern typically signifies a decreasing selling trend and the emergence of a bullish trend in the market.
Three White Soldiers Pattern
It is another three-candle pattern with three green candles. Each candle has a minor wick and an opening and closing at a higher level than the day before. If this pattern is observed after a downtrend in the market, it suggests that there will be a bullish market trend in the near future.
Bearish Patterns
Bearish candlestick patterns primarily form right after an uptrend and signal a point of resistance. Here are some of the most common bearish candlestick patterns.
Hanging Man Pattern
The hanging man pattern displays a short candle body with a long lower wick. This candlestick pattern is mostly found at the peak of an upward trend. It indicates that the selling pressures are higher, surpassing the buying momentum and suggesting bears are getting market control.
Shooting Star Pattern
Another popular bearish candlestick pattern is the shooting star pattern. This candle exhibits a brief body with an elongated upper wick. Shooting star candlestick can be seen at the pinnacle of an upward trend. In this case, the market often opens higher than the previous day and witnesses a short-lived rally before a flat decline which resembles a shooting star.
Bearish Engulfing Pattern
Contrary to the bullish engulfing pattern, the bearish engulfing pattern also includes two candles, but the first one is a small green fully engulfed by the next large candle. The pattern is mostly noticed at the peak of an uptrend signalling a declaration of upward market movement and an impending downtrend.
Evening Star Pattern
The evening star bearish pattern includes three candlesticks in which a small candle is sandwiched between one long green and one long red candle without any of them overlapping with each other. It is a clear indication of the reversal of the upward trend.
Three Black Crows Pattern
Lastly, the three Black crows candlestick pattern exhibits three consecutive red candles with small wicks. Each of them opens and closes at smaller levels. Observing it after an upward trend indicates an imminent bear market.
Conclusion
The candlestick pattern is a stock market analysis tool that provides traders with a deep understanding and insight into the stock market and helps them identify potential market and price movements. That is why learning about candlestick pattern reading is essential to navigate stock market trends and discover the best selling and buying opportunities. We have detailed how to read candlestick patterns and other essential details such as candlestick composition, different candlestick patterns, how to analyze, and more.
Disclaimer
The stocks mentioned in this article are not recommendations. Please conduct your own research and due diligence before investing. Investment in securities market are subject to market risks, read all the related documents carefully before investing. Please read the Risk Disclosure documents carefully before investing in Equity Shares, Derivatives, Mutual fund, and/or other instruments traded on the Stock Exchanges. As investments are subject to market risks and price fluctuation risk, there is no assurance or guarantee that the investment objectives shall be achieved. Lemonn (Formerly known as NU Investors Technologies Pvt. Ltd) do not guarantee any assured returns on any investments. Past performance of securities/instruments is not indicative of their future performance.
Related Posts


Download Lemonn
Download my trading app for SIP, demat account services—get a free demat account with our demat apps.


