
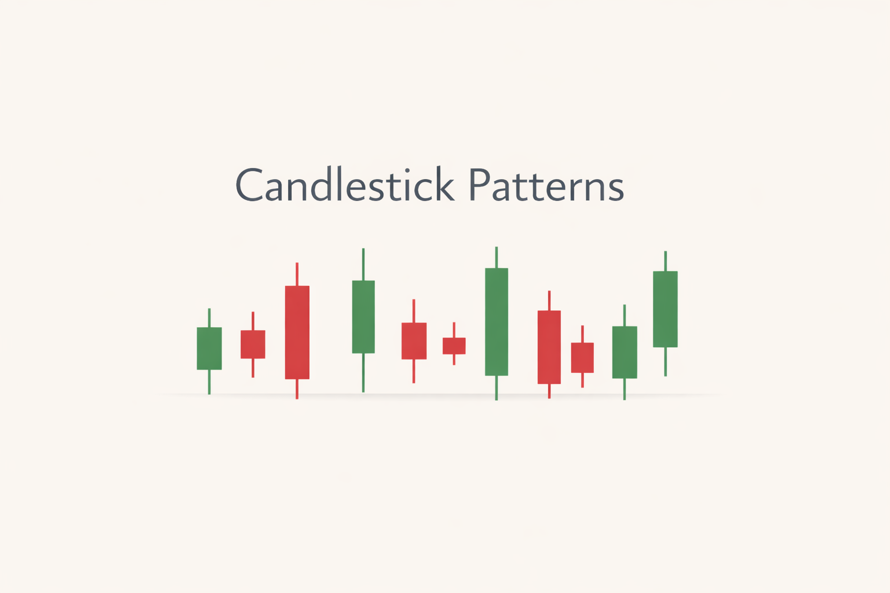
Candlestick Patterns Explained: A Beginner’s Guide
Candlestick patterns help you understand market sentiment and predict price movements. Traders use them to spot trends, reversals, and entry points in stocks, forex, and crypto.
If you are new to trading, learning a few key patterns can improve your decision-making quickly.
What Are Candlestick Patterns?
A candlestick shows price movement in a specific time frame. Each candle has:
- Open price
- Close price
- High
- Low
The body shows the open and close, while the wicks show the highs and lows.
- Green candle: price went up
- Red candle: price went down
Types of Candlestick Patterns
Candlestick patterns fall into three main categories:
- Bullish patterns (price likely to go up)
- Bearish patterns (price likely to go down)
- Continuation patterns (trend likely to continue)
“Start investing with confidence! Explore
share market
and grow your wealth.”
Top Bullish Candlestick Patterns
1. Hammer
Signal: Potential reversal from downtrend to uptrend
- Small body, long lower wick
- Appears after a price drop
What it means: Buyers are stepping in after selling pressure.
2. Bullish Engulfing
Signal: Strong reversal upward
- Small red candle followed by a large green candle
- Green candle fully covers previous candle
What it means: Buyers have taken control.
3. Morning Star
Signal: Strong bullish reversal
- Three candles: red, small-bodied, then strong green
- Appears at the bottom of a downtrend
Top Bearish Candlestick Patterns
1. Shooting Star
Signal: Reversal from uptrend to downtrend
- Small body with long upper wick
- Appears after price rise
2. Bearish Engulfing
Signal: Strong downward reversal
- Small green candle followed by a large red candle
- Red candle engulfs previous candle
3. Evening Star
Signal: Strong bearish reversal
- Three candles: green, small-bodied, then strong red
- Appears at the top of an uptrend
Continuation Patterns to Know
1. Doji
Signal: Market indecision
- Open and close prices are almost equal
What it means: Trend may pause or reverse.
2. Spinning Top
Signal: Weak momentum
- Small body with wicks on both sides
How to Use Candlestick Patterns Effectively
Candlestick patterns work best when combined with other tools.
1. Use with Support and Resistance
Patterns near key levels are more reliable.
2. Confirm with Volume
High volume strengthens the signal.
3. Follow the Trend
Avoid trading against strong trends without confirmation.
Common Mistakes to Avoid
- Relying on a single pattern
- Ignoring market context
- Overtrading based on weak signals
- Not using stop-loss
Are Candlestick Patterns Reliable?
Candlestick patterns are not 100% accurate. They provide probability, not certainty.
Experienced traders use them along with:
- Technical indicators (RSI, MACD)
- Trend analysis
- Market news
FAQs
Q. Which candlestick pattern is most reliable?
Bullish and bearish engulfing patterns are considered highly reliable when confirmed with volume.
Q. Can beginners use candlestick patterns?
Yes. Start with simple patterns like hammer and engulfing.
Q. Which timeframe is best?
Patterns work on all timeframes, but higher timeframes (daily, weekly) are more reliable.
Key Takeaways
- Candlestick patterns show market psychology
- Learn a few strong patterns instead of many
- Always confirm signals with other indicators
- Risk management is essential
Disclaimer
The stocks mentioned in this article are not recommendations. Please conduct your own research and due diligence before investing. Investment in securities market are subject to market risks, read all the related documents carefully before investing. Please read the Risk Disclosure documents carefully before investing in Equity Shares, Derivatives, Mutual fund, and/or other instruments traded on the Stock Exchanges. As investments are subject to market risks and price fluctuation risk, there is no assurance or guarantee that the investment objectives shall be achieved. Lemonn (Formerly known as NU Investors Technologies Pvt. Ltd) do not guarantee any assured returns on any investments. Past performance of securities/instruments is not indicative of their future performance.
Related Posts
Download Lemonn
Download my trading app for SIP, demat account services—get a free demat account with our demat apps.


