Stock Market Highlights Today: Nifty gains 132 points, is the pullback losing steam? – 10th June 2026
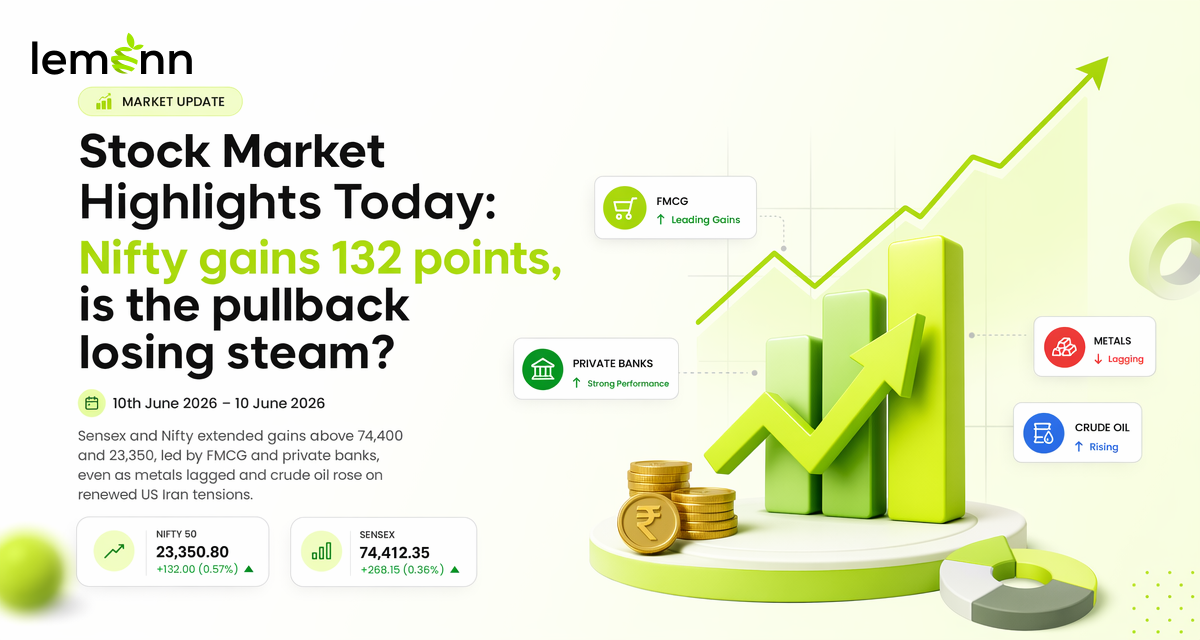
Indian equities extended their rebound for a second straight session on Wednesday, with the Nifty 50 closing above 23,350 and the Sensex near 74,450, helped by buying in FMCG, private banks and select heavyweights despite firmer crude and lingering US Iran tensions.
Broader markets lagged the large-cap benchmarks, while metals and auto stocks eased and volatility stayed contained around the mid-15 level.
Market overview
| Index | 10 Jun 2026 Close (approx.) | Move & % Change | Comments |
|---|---|---|---|
| Sensex | 74,415 | +497 pts (+0.67%) | Held gains through the session, driven by FMCG, banks and Reliance. |
| Nifty 50 | 23,374 | +132 pts (+0.57%) | Closed above 23,350 after testing intraday highs near 23,410. |
| Nifty Midcap 100 | approx. flat | marginal move | Traded with small gains, underperformed large caps. |
| Nifty Smallcap 100 | approx. flat | marginal move | Also saw muted action after prior-session strength. |
| India VIX | 15.47–15.71 | mixed, around -0.7% to +0.85% | Volatility stayed contained in mid-teens range. |
Note: figures are approximate; final exchange data not available at time of publication.
- Sensex added more than 1,000 points over the last two sessions.
- Nifty 50 climbed about 287 points over two days, crossing 23,400 intraday.
- BSE market capitalisation rose by over ₹5 lakh crore in two sessions to above ₹460 lakh crore, per BSE figures.
- On NSE, around 1,386 stocks advanced, 1,741 declined, 99 were unchanged in one mid-session snapshot.
Key movers
Top gainers
| Stock | Sector | Notable Factor |
|---|---|---|
| Hindustan Unilever (HUL) | FMCG | Gained over 2 percent, led Sensex and Nifty gains. |
| ICICI Bank | Private Bank | Rose around 2 percent, supported index recovery. |
| Axis Bank | Private Bank | Advanced about 2 percent, part of banking strength. |
| Kotak Mahindra Bank | Private Bank | Climbed near 2 percent, aided financials. |
| Reliance Industries | Oil & Gas | Gained around 1 percent, added to large-cap support. |
| ITC | FMCG | Rose about 1 percent, backed FMCG index gains. |
| Larsen & Toubro (L&T) | Capital Goods | Up around 1 percent, contributed to Sensex upside. |
| Asian Paints | Consumer | Added roughly 1 percent, tracked FMCG/consumption theme. |
| Power Grid | Utilities | Gained near 1 percent, defensive buying interest. |
| State Bank of India (SBI) | PSU Bank | Up about 1 percent, aided banking pack. |
| Adani Ports | Ports & Logistics | Rose around 1 percent, supported Nifty. |
| Infosys | IT | Advanced roughly 1 percent, cushioned Nifty IT. |
| TCS | IT | Gained about 1 percent, offset weakness in select IT names. |
| Trent | Retail | Rose around 1 percent, featured among Sensex gainers. |
| HDFC Bank | Private Bank | Up near 1 percent, remained a key index driver. |
Note: figures are approximate; final exchange data not available at time of publication.
- Buying in heavyweights was a key driver of index gains.
- Nifty Financial Services participation remained strong, aided by private lenders.
Top losers
| Stock | Sector | Notable Factor |
|---|---|---|
| Tata Steel | Metal | Fell nearly 1 percent, led losses on Sensex and Nifty. |
| Eternal | Not specified | Declined close to 1 percent, among notable laggards. |
- Nifty Metal index underperformed, reflecting pressure in steel and metals.
Sectoral action
| Sector / Index | Direction (approx.) | Key Drivers |
|---|---|---|
| Nifty FMCG | up 0.75% | Gains in HUL, ITC, Asian Paints supported the index. |
| Nifty Oil & Gas | up 0.59% | Reliance strength offset concerns from higher crude. |
| Nifty IT | up 0.36% | TCS, Persistent cushioned index despite Infosys drag. |
| Nifty Private Bank | up >1% | ICICI Bank, Axis Bank, Kotak Bank led gains. |
| Nifty Metal | down 0.7% to 1.02% | Tata Steel weakness weighed; sector was top laggard. |
| Nifty Auto | slightly down | Saw mild profit taking after recent gains. |
| Nifty PSU Bank | slightly down | Traded soft despite strength in select names like SBI. |
| Nifty Realty | slightly down | Edged lower, underperformed headline indices. |
Note: figures are approximate; final exchange data not available at time of publication.
- Sectoral performance was mixed, with defensives and banks outperforming cyclicals.
- Nifty 500 companies delivered double-digit earnings growth in Q4 FY26 despite geopolitical and macro headwinds, as per index-level data.
- In IT, investors remained wary of AI-led disruption after Anthropic model launches, keeping sentiment in check.
Technical outlook on Nifty and Sensex
| Statistic | Value / Range | Context |
|---|---|---|
| Nifty immediate support | 23,260–23,280 | Seen as crucial intraday support zone. |
| Nifty key support | 23,000–23,100 | Confluence of 61.8% retracement and channel support. |
| Nifty resistance | 23,500–23,550 | Aligns with 20-day EMA and recent swing high. |
| Alternative resistance band | 23,510–23,530 | Break above may extend rally towards 23,730. |
| Lower support band | 23,000–22,900 | Next downside zone if 23,260 breaks. |
| Sensex support | 74,000 | Identified as key support level. |
| Sensex resistance | 74,800 | Upside cap in near term. |
Note: figures are approximate; final exchange data not available at time of publication.
- An inverted hammer / hammer pattern in prior session lent a positive bias.
- Holding above 23,000–23,100 keeps the pullback trend intact, according to technical commentary.
- Call writing was noted at 23,400 and 23,500 strikes, with strong put interest at 23,300 and 23,200.
- “The zone of 23,260–23,280 will act as a crucial support for the index while the resistance lies in the zone of 23,510–23,530”
— SBI Securities Mid-Market Index View
Global cues and macro backdrop
| Market / Asset | Movement | Notes |
|---|---|---|
| Brent crude | around +1% to above $92 | Rebounded from seven-week low after fresh US strikes on Iran. |
| WTI crude | nearly +1% to about $89 | Supported by US inventory draw and geopolitical risk. |
| Kospi (South Korea) | about -5% | AI-led tech rally unwound amid risk-off mood. |
| Nikkei (Japan) | about -2% | Tracked global tech weakness and risk aversion. |
| Taiwan Weighted | more than -3% | AI trade fatigue hit semiconductor-heavy market. |
| USD/INR (onshore) | rupee at 95.54, -0.2% | Rupee opened weaker versus prior close of 95.35. |
Note: figures are approximate; final exchange data not available at time of publication.
- US Iran tensions escalated after US airstrikes and Iranian retaliation around the Strait of Hormuz.
- Iran reported targeting an air base in Jordan hosting US forces; Bahrain and Kuwait activated air defences.
- Crude had earlier eased below $92 per barrel, but bounced on renewed tensions and US stockpile data.
- “The market is likely to largely ignore the escalation of the conflict in West Asia as a one-off. Despite the escalation, Brent crude continues to trade below the $93 level”
— VK Vijayakumar, Chief Investment Strategist, Geojit Investments
- RBI’s concessional forex swap window has supported banking and financial stocks by facilitating overseas borrowing and FX liquidity, per market commentary.
- Recent FPI selling in BFSI has been linked to elevated bond yields, higher crude, commodity costs and currency volatility.
- “The ongoing correction is helping valuations normalize and improving the risk-reward equation for long-term investors”
— Rahul Singh, CIO – Equities, Tata Asset Management
Key market statistics and flows
| Statistic | Value / Change | Context |
|---|---|---|
| India VIX | around 15.5 | Indicates moderate volatility despite geopolitical risks. |
| Equity MF inflows (May) | ₹22,908 crore | Lowest in a year, down 40 percent vs April. |
| Equity MF inflows (April) | ₹38,440 crore | Higher prior month inflow, per Amfi data. |
| Industry net flows (May) | –₹64,131 crore | Driven by ₹96,948 crore withdrawals from debt funds. |
| MF AUM (May end) | ₹81.6 lakh crore | Down from ₹81.92 lakh crore in April. |
- Equity inflows have moderated from ₹40,450 crore in March to ₹22,908 crore in May.
- Market participants are watching potential Finance Ministry measures to attract foreign capital and ease currency pressure.
- “Going forward, developments in West Asia, crude oil prices, monsoon progress, IPO activity, foreign fund flows and global macroeconomic cues will be key monitorables”
— Siddhartha Khemka, Head of Research, Wealth Management, Motilal Oswal Financial Services
Valuations and broader-market context
- Nifty 50 trades around 20 times earnings, described as fairly valued but not cheap in commentary.
- Nifty Midcap index is near 29 times earnings, Nifty Smallcap around 33 times earnings.
- The valuation gap between large caps and broader markets remains wide amid sustained FPI selling.
- Over the longer term since May 2014, Sensex and Nifty have gained about 198 percent and 214 percent respectively.
- BSE market capitalisation has risen by about ₹374 lakh crore over that period, aided by new listings and capital issuance.
- Nifty Metal has rallied 309 percent since 2014, while financials and autos have each gained around 300 percent.
- Nifty Midcap 100 has surged 473 percent over the same span, outpacing large caps.
Frequently Asked Questions
Why did Nifty close above 23,350 despite higher crude prices?
– Strong buying in FMCG, private banks and heavyweights like HUL, ICICI Bank and Reliance offset the drag from metals and autos, helping Nifty hold above 23,350 even as Brent crude rebounded above $92 per barrel.
Which sectors led and lagged the market today?
– FMCG, private banks, oil & gas and IT indices ended higher, while metals, auto, PSU banks and realty indices edged lower, making sectoral performance mixed.
What key technical levels should traders watch on Nifty?
– Immediate support lies near 23,260–23,280, with stronger support at 23,000–23,100; resistance is seen around 23,500–23,550, and a break above 23,530 could open room towards 23,730.
Disclaimer
The stocks mentioned in this article are not recommendations. Please conduct your own research and due diligence before investing. Investment in securities market are subject to market risks, read all the related documents carefully before investing. Please read the Risk Disclosure documents carefully before investing in Equity Shares, Derivatives, Mutual fund, and/or other instruments traded on the Stock Exchanges. As investments are subject to market risks and price fluctuation risk, there is no assurance or guarantee that the investment objectives shall be achieved. Lemonn (Formerly known as NU Investors Technologies Pvt. Ltd) do not guarantee any assured returns on any investments. Past performance of securities/instruments is not indicative of their future performance.