Banks lift Sensex as Nifty slips, are midcaps blinking?
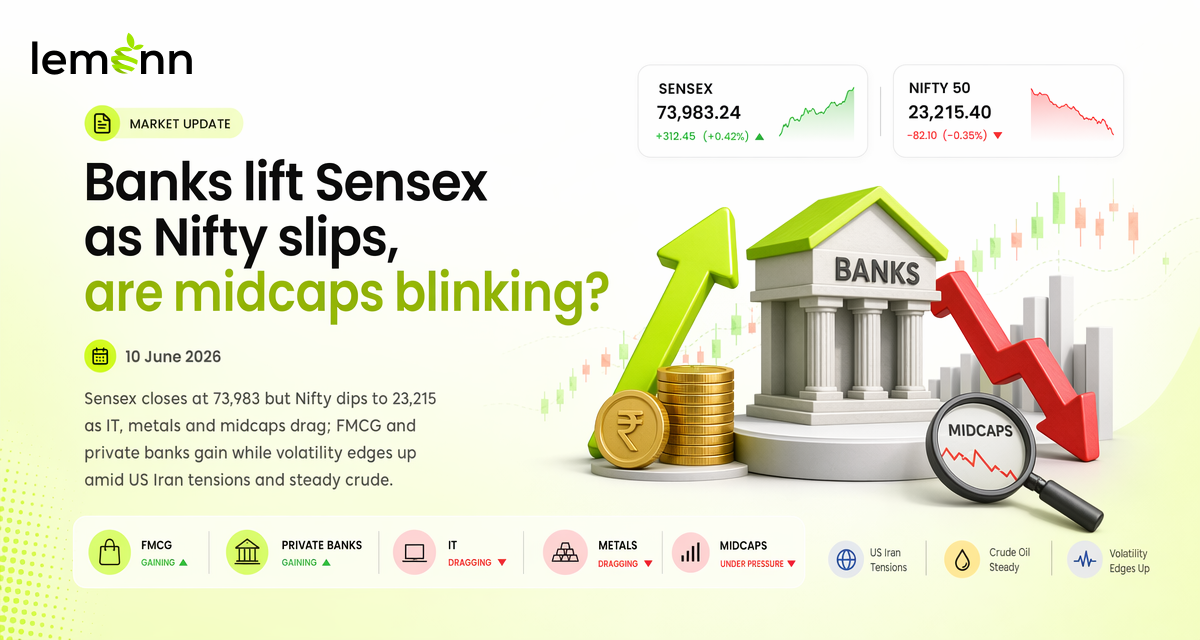
Indian equities ended mixed on Wednesday as the Sensex added 64 points to close at 73,983, while the Nifty 50 slipped 27 points to 23,215, with profit booking in IT, metals and broader markets offsetting gains in FMCG and private banks despite steady crude and lingering US Iran tensions.
Market overview
| Index | 10 Jun Close | Move & % Change | Comments |
|---|---|---|---|
| Sensex | 73,983 | +64 pts (+0.09%) | Gave up most of a 1,000-point two-day rebound. |
| Nifty 50 | 23,215 | -27 pts (-0.12%) | Failed to hold above 23,400 intraday, closed below 23,250. |
| Nifty Midcap | approx. 59,810 | -905 pts (approx. -1.5%) | Underperformed; sharp intraday fall in broader markets. |
| Nifty Smallcap 100 | n.a. | down over 1% | Extended weakness after prior session’s surge. |
| India VIX | 15.61 | up to near 15.6 | Volatility edged higher, reflecting cautious sentiment. |
Note: figures are approximate; final exchange data not available at time of publication.
- Intraday, Nifty hit around 23,410–23,450 before reversing.
- Sensex closed about 625 points below the day’s high, according to BSE figures.
- NSE advance-decline ratio stood near 1:3, indicating weak breadth.
- Around 2,258 NSE stocks declined, 1,038 advanced, 82 were unchanged.
Key movers
Top gainers
| Top Gainers | Sector | Notable Factor |
|---|---|---|
| Hindustan Unilever (HUL) | FMCG | Rose over 2%; led Sensex gains. |
| Axis Bank | Private Bank | Gained about 1.7%; buying in large lenders. |
| Kotak Mahindra Bank | Private Bank | Up around 1.7%; supported indices. |
| ICICI Bank | Private Bank | Added about 1.4%; part of bank-led support. |
| HDFC Bank | Private Bank | Advanced over 1%; benefited from sector strength. |
| ITC | FMCG | Gained about 1.3%; FMCG index outperformed. |
| Nestle India | FMCG | Rose around 2%; lifted FMCG basket and Sensex. |
Top losers
| Top Losers | Sector | Notable Factor |
|---|---|---|
| Infosys | IT | Among biggest drags; extended IT index weakness. |
| Eternal (Zomato-parent) | Consumer/Tech | Fell around 2%; weighed on Sensex. |
| Tata Steel | Metal | Declined nearly 2%; Nifty Metal index lagged. |
| Bajaj Finserv | Financials | Dropped around 2%; pressure in broader financials. |
| Hindalco Industries | Metal | Featured among key laggards. |
| Coal India | Metal & Mining | Closed in the red; part of metal weakness. |
| Oil & Natural Gas Corporation (ONGC) | Oil & Gas | Declined; selling in energy names. |
| Tata Motors | Auto | Among major losers from Sensex basket. |
| Indian Bank | PSU Bank | Fell over 10% after a downgrade to underweight. |
| NLC India | Power/Mining | Dropped about 5%. |
| Newgen Software | IT | Lost over 3% after CEO resignation. |
- Nifty IT index fell for a sixth straight session, with all stocks lower except TCS.
- Selling in Oil India, Kalyan Jewellers, PC Jeweller added pressure in midcaps.
Sectoral action
| Sector/Index | Direction (approx.) | Key Drivers |
|---|---|---|
| Nifty FMCG | up about 1% | Gains in HUL, ITC, Nestle; expectations of price hikes. |
| Nifty Private Bank | up over 1% | Strength in Axis, Kotak, ICICI, HDFC Bank. |
| Nifty IT | down (6th day) | Persistent selling; Infosys among top drags. |
| Nifty Metal | down around 1–2% | Softer commodity prices; Tata Steel, Hindalco weak. |
| Nifty Realty | down around 2% | Broader risk-off in high beta names. |
| PSU Bank index | lower | Hit by sharp fall in Indian Bank. |
| Auto index | lower | Tata Motors, M&M under pressure. |
- Nifty FMCG was the top-performing sectoral index.
- Broader indices, including midcaps and smallcaps, ended over 1% lower.
- Market breadth within Nifty 500 was weak, with 386 stocks ending in the red.
Technical outlook for Nifty 50
- Nifty formed a small-bodied candle with an upper wick, signalling profit booking at higher levels.
- The index continues to make lower highs and lower lows on the daily chart.
- Nifty trades below its 20-day moving average, indicating short-term pressure.
- Relative Strength Index (RSI) remains below 50, reflecting subdued momentum.
- Buying interest is visible near 23,000–23,100.
- Overhead resistance seen at 23,450–23,550.
- Immediate support lies around 23,200, with positional support at 23,000–23,100.
- Expected trading range cited at 23,000–23,550.
- “The broader trend remains weak as Nifty continues to form lower highs and lower lows”
– “Hence, a range-bound approach is preferred over a directional view”
— Vatsal Bhuva, Technical Analyst, LKP Securities.
Global cues and macro backdrop
| Market/Asset | Movement | Notes |
|---|---|---|
| US Iran tensions | Escalated | US airstrikes followed by Iranian missile and drone attacks in West Asia. |
| Brent crude | around +1% to near $92 | Rebounded from seven-week low; still below recent multi-year highs. |
| WTI crude | down to about $88 | Eased from above $100 seen after Strait of Hormuz closure. |
| Asian equities | broadly lower | Kospi down about 5%, Nikkei around 2%, Taiwan over 3%. |
| USD/INR | 95.27 per dollar (approx.) | Rupee slightly firmer versus prior close of 95.35. |
Note: figures are approximate; final market data not available at time of publication.
- Iran’s Revolutionary Guards reported strikes on US-linked bases in Jordan, Kuwait and Bahrain.
- Crude’s pullback from recent highs eased some concerns for India’s import bill.
- Domestic equities tracked weak global cues and awaited a key US inflation print.
Flows, volatility and broader sentiment
| Statistic | Value/Change | Context |
|---|---|---|
| India VIX | 15.61 | Volatility ticked up, signalling caution after recent swings. |
| Advance-decline (NSE) | 1,038 / 2,258 | Declines outpaced advances, highlighting broad-based selling. |
| Rupee | 95.2650 per dollar | Marginal appreciation; reflects steady FX flows. |
- Recent FPI selling in BFSI reflects elevated global bond yields and crude, as per market commentary.
- Domestic bond yields eased on policy support to debt markets.
- Mutual fund inflows showed signs of slowing, adding to equity market pressure.
Strategist and sector views
- Rohit Srivastava of Indiacharts.com remains positive on metals and financials despite volatility.
- He views the metal correction as a pullback within a longer-term commodity upcycle.
- Srivastava prefers sectors linked to economic growth, stays cautious on FMCG and IT.
- “Domestic equities ended lower amid weak global cues, as investors turned cautious ahead of a key US inflation print”
– “Early gains were reversed due to profit booking”
— Vinod Nair, Head of Research, Geojit Investments.
- Nair highlighted FMCG outperformance and private bank gains after RBI eased FCNR(B) and ECB norms.
- Metals lagged on softer commodity prices, while unresolved geopolitical risks kept investors guarded.
FAQ
Q: Why did the Sensex gain while the Nifty closed lower?
- The Sensex is more heavily weighted to large private banks and FMCG stocks, which rose, while Nifty components from IT and metals, including Infosys and Tata Steel, dragged the broader index into the red.
Q: What is the near-term trading range for Nifty 50?
- Technical analysis cited a likely range of 23,000–23,550, with immediate support at 23,200 and resistance around 23,450–23,550.
Q: How are midcaps and smallcaps positioned compared with large caps?
- Nifty Midcap and Smallcap indices fell over 1%, have struggled to stay above key moving averages, and continue to underperform large caps as risk appetite moderates in the broader market.
Frequently Asked Questions
Why did the Sensex gain while the Nifty closed lower?
The Sensex benefited from gains in large private banks and FMCG heavyweights, while Nifty was dragged by IT and metal stocks like Infosys and Tata Steel, leading to a divergence between the two benchmarks.
What is the near-term trading range for Nifty 50?
Technical analysis points to a range of 23,000–23,550, with immediate support near 23,200 and key resistance around 23,450–23,550.
How are midcaps and smallcaps performing versus large caps?
Midcap and smallcap indices declined over 1%, remain below key moving averages, and are underperforming large caps as broader market risk appetite softens.
Disclaimer
The stocks mentioned in this article are not recommendations. Please conduct your own research and due diligence before investing. Investment in securities market are subject to market risks, read all the related documents carefully before investing. Please read the Risk Disclosure documents carefully before investing in Equity Shares, Derivatives, Mutual fund, and/or other instruments traded on the Stock Exchanges. As investments are subject to market risks and price fluctuation risk, there is no assurance or guarantee that the investment objectives shall be achieved. Lemonn (Formerly known as NU Investors Technologies Pvt. Ltd) do not guarantee any assured returns on any investments. Past performance of securities/instruments is not indicative of their future performance.