SBI share price plunges 11% after Q4 margin miss and downgrades
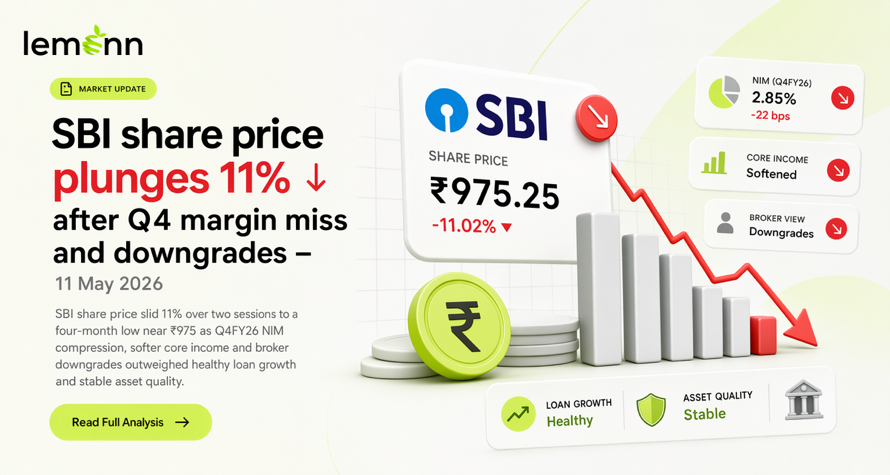
State Bank of India (SBI) shares fell about 11% in two sessions to a four‑month low near ₹975 by Monday, as investors reacted to weaker‑than‑expected March quarter margins and core income despite a 5.6% year‑on‑year rise in net profit to about ₹19,684 crore. The selloff, which began after the Q4 FY26 results were released on Friday, wiped out roughly ₹1.1 lakh crore in market capitalisation and triggered a wave of earnings downgrades, though brokerages largely retained positive or neutral ratings.
Market overview and price damage
| Statistic | Value/Change | Context |
| Latest close | ~₹975 per share | Four‑month low after post‑results selloff |
| Two‑day move | Down about 11% | Reaction to Q4 FY26 earnings miss |
| Friday move | Near 7% intraday/close loss | Results were announced during market hours |
| Monday move | About 4.5% intraday decline | Selling extended for a second session |
| Market cap | About ₹9 lakh crore | Down roughly ₹1.11 lakh crore in two days |
- SBI weekly return slipped about 4.6%, with one‑month return down around 8%.
- Three‑month return turned negative at about 17.5%, per live price data.
- Despite the correction, one‑year return remained near 26%, and five‑year return about 169%.
- Trading volume on Monday surged to about 4.8 crore shares, well above the recent seven‑day average.
What in Q4 FY26 spooked investors
| Metric | Q4 FY26 | YoY / QoQ change | Notes |
| Standalone net profit | ₹19,683.75 crore | Up 5.6% YoY, down 6.4% QoQ | Profit still grew YoY |
| Operating profit | ₹27,704 crore | Down 11.45% YoY, 15.70% QoQ | Core operating performance weakened |
| Net interest income (NII) | ₹44,380 crore | Up ~4% YoY, down 1.35% QoQ | Growth lagged loan growth |
| Whole‑bank NIM | 2.81% | Down 18 bps QoQ | Below Street expectations |
| Domestic NIM (Q4) | 2.93% | Down 21 bps YoY, 18 bps QoQ | Key driver of disappointment |
| Domestic NIM (FY26) | 3.03% | Management guide above 3% | Focus on FY27 trend |
| Provisions (total) | ~₹2,872 crore | Down sharply YoY | Supported bottom line |
| Gross NPA ratio | 1.49% | Improved YoY | Asset quality strengthened |
| Net NPA ratio | 0.39% | Stable and low | Credit costs under control |
- NII growth of about 4% YoY was modest versus roughly 17% loan growth cited by some brokerages.
- Margin compression stemmed from repo rate transmission, MCLR cuts and migration of some corporate loans to T‑bill‑linked rates.
- Treasury profits weakened due to a spike in bond yields, adding to pressure on operating profit.
- Slippages rose sequentially, largely seasonal and agriculture‑linked, but still weighed on sentiment.
Why margins and yields are under pressure
- Around half of SBI’s loan book is linked to external benchmark lending rates, which reset after the RBI’s 25 bps repo cut in December.
- MCLR reductions and higher share of T‑bill‑linked corporate loans lowered yields on advances.
- One brokerage noted NIM excluding an IT refund fell 18 bps QoQ and was 16 bps below its estimate.
- Management reiterated guidance of domestic NIM above 3% and 13–15% loan growth for FY27.
- Return on assets slipped to about 1.07%, partly due to NIM compression and treasury mark‑to‑market losses.
Broker reactions and rating changes
| Broker | Rating action | Target price | Key rationale |
| Nomura | Cut to Neutral from Buy | ₹1,140 | Sees higher sustainable credit costs under new ECL norms, RoE sustainability risk |
| IIFL | Cut to Add from Buy | ₹1,140 | Lower NII, EPS CAGR cut to 7% for FY26‑28, higher credit cost assumptions |
| Morgan Stanley | Equal‑weight, TP cut | ₹980 | NIM miss, yields hit by T‑bill‑linked loans, NIM and EPS forecasts trimmed |
| Citigroup | Buy, TP trimmed | ₹1,230 | NIM compression and weaker fee income; credit costs contained |
| Bernstein | Outperform, TP retained | ₹1,300 | Strong loan growth, stable asset quality, CET1 improving despite margin pressure |
| Motilal Oswal | Buy, TP retained | ₹1,300 | Mixed quarter; expects NIM above 3% with corrective measures |
| Macquarie | Buy | ₹1,150 | Asset quality a bright spot; RoE expected near 15% |
| JPMorgan | Overweight | ₹1,225 | Benign asset quality, seasonal slippages; core income miss acknowledged |
| UBS | Neutral | ₹1,080 | Expects RoA near 0.95% in FY27‑28; risk‑reward seen as fair |
- Around 50 analysts cover SBI, with 43 Buy and the rest Hold or equivalent; no Sell ratings reported.
- One brokerage highlighted SBI trades near 1.2 times FY28E book value, limiting scope for re‑rating at current multiples.
- Another estimated the stock at about 1.6 times FY27 price‑to‑book, calling this comfortable given expected RoE.
- Some houses cut FY27–28 NIM forecasts by over 20 bps and EPS estimates by 2–5%.
- “SBI’s core fundamentals are stable, and delivery on growth along with controlled credit costs should support return ratios sustaining above 1%. However, we believe these outcomes will be overshadowed by the NIM/NII performance in FY27E.” — JM Financial (brokerage comment).
Technical and trading signals
| Statistic | Value/Change | Context |
| Last traded price | ₹973.6–₹975 | As of late trade Monday |
| P/E ratio | 10.76 | Based on trailing EPS of ₹90.24 |
| 3‑day SMA | ₹1,069.10 | Price now well below short‑term average |
| 5‑day EMA | ₹1,068.05 | Indicates short‑term bearish trend |
| Six‑month beta | 1.6862 | Higher volatility than broader market |
| One‑month return | Down about 8–10% | Reflects recent correction |
- Price is trading significantly below short‑term moving averages, signalling near‑term technical weakness.
- Elevated beta suggests sharper price swings relative to the benchmark indices.
- Volume spike during the decline points to strong institutional and retail participation in the selloff.
What could drive SBI share price next
- Margin trajectory: whether domestic NIM can revert and sustain above 3% as guided.
- Credit costs: impact of transition to expected credit loss norms on RoA and RoE.
- Treasury performance: bond yield movements and scope for treasury gains or further mark‑to‑market hits.
- Loan mix: pace of growth in SME, agriculture and corporate segments versus lower‑yield portfolios.
- Valuation: with the stock de‑rating after the fall, future moves may track delivery on FY27 profitability guidance.
FAQs
Q: Why is the SBI share price falling despite profit growth in Q4 FY26?
NIM and NII missed expectations, operating profit fell double‑digit, and margins compressed due to rate transmission and loan repricing. Brokerages cut earnings and NIM forecasts, triggering a valuation reset despite YoY profit growth.
Q: How serious is the asset quality situation at SBI after Q4 FY26?
Gross NPA ratio improved to 1.49% and net NPA stayed low at 0.39%. Slippages rose sequentially but were described as seasonal and largely agriculture‑led, with credit costs remaining contained.
Q: Are analysts turning negative on SBI after the results?
Two major houses downgraded to Neutral/Add from Buy and several cut target prices, but none of the roughly 50 covering analysts reportedly has a Sell rating. Most still expect RoA near or above 1% and RoE in mid‑teens, contingent on margin recovery.
Q: Why did SBI shares drop 11% in two sessions after Q4 FY26?
The decline followed weaker‑than‑expected Q4 margins and core income, double‑digit operating profit contraction, and a series of earnings and target price cuts from brokerages, even though net profit still grew year‑on‑year.
Q: What is the key concern for SBI investors after the March quarter results?
The main concern is sustained net interest margin pressure from repo rate transmission, MCLR cuts and migration to T‑bill‑linked loans, which could cap RoA and RoE despite healthy loan growth and benign asset quality.
Q: Did brokerages issue any Sell ratings on SBI after the results miss?
No Sell ratings were reported; about 43 analysts still rate SBI a Buy and the rest Hold or equivalent, though several firms downgraded from Buy to Neutral/Add and trimmed NIM and EPS estimates along with target prices.
Disclaimer
The stocks mentioned in this article are not recommendations. Please conduct your own research and due diligence before investing. Investment in securities market are subject to market risks, read all the related documents carefully before investing. Please read the Risk Disclosure documents carefully before investing in Equity Shares, Derivatives, Mutual fund, and/or other instruments traded on the Stock Exchanges. As investments are subject to market risks and price fluctuation risk, there is no assurance or guarantee that the investment objectives shall be achieved. Lemonn (Formerly known as NU Investors Technologies Pvt. Ltd) do not guarantee any assured returns on any investments. Past performance of securities/instruments is not indicative of their future performance.