
What is CPR in Trading?
Introduction to CPR (Central Pivot Range)
CPR in Trading (Central Pivot Range) is a technical analysis tool that gives traders a simple way to understand market balance, support zones, resistance zones, and possible trend direction based on the previous day’s price data. In other words, CPR condenses the previous day’s price behavior into three levels that guide intraday decisions. Traders observe how the price interacts with this range to judge momentum and strength.
Meaning and Concept of CPR in Stock Trading
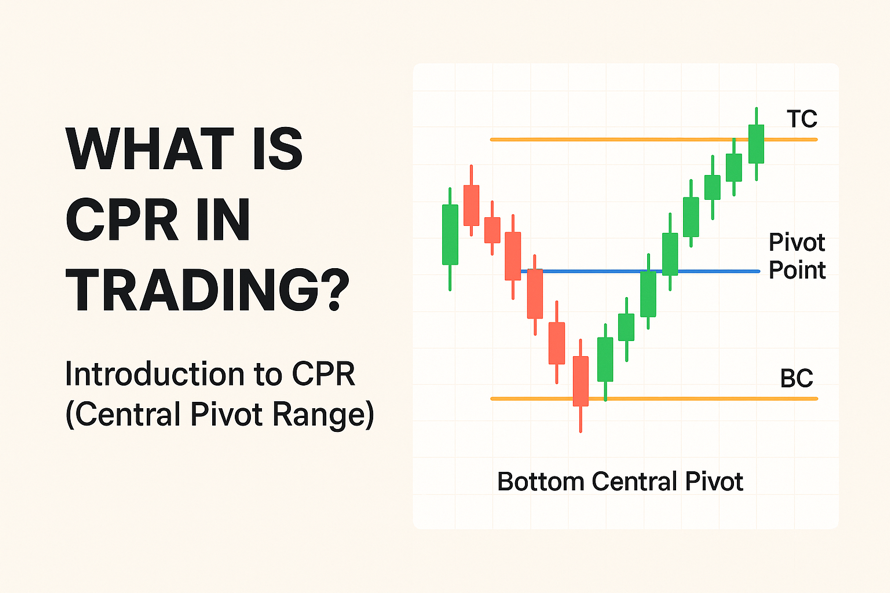
CPR in Trading reflects the average value of the market from the previous session. It serves as a central reference for traders to assess the direction of the stock price. CPR consists of three boundaries: the Top Central Pivot (TC), the central Pivot Point, and the Bottom Central Pivot (BC). Together, they shape a zone that highlights market balance or imbalance.
“Start investing with confidence! Explore
0 demat account
and grow your wealth.”
Importance of CPR for Technical Traders
Technical traders value CPR because it helps them remain objective. CPR simplifies decision-making by providing clear zones that guide entry and exit points. Instead of reading multiple indicators, traders use CPR lines to see momentum, exhaustion, and continuation.
How CPR Helps Identify Market Trends and Reversals
Trend shifts often begin near CPR. Breaks above TC create upward momentum. Breaks below BC create downward momentum. Frequent hesitation near the pivot point signals possible reversal behavior.
Components of CPR
CPR has a three-line structure that shapes the trading range. Each line represents a relationship between the high, low, and close of the previous session. These lines help traders understand where buyers and sellers may react. Price often uses these boundaries as zones for pullbacks, rejections, or breakouts. Once a trader learns the purpose of each CPR layer, chart reading becomes more intuitive.
TC (Top Central Pivot)
TC forms the upper region of the range. When the price approaches TC, traders observe resistance behavior. Strong candles above TC reflect buyer dominance.
Pivot Point (Central Pivot)
The central pivot is the average of the previous day’s high, low, and close. It reflects market equilibrium. Movement around the pivot reveals early directional clues.
BC (Bottom Central Pivot)
BC works as the lower boundary. Buyers often defend this zone. Breaks below BC increase selling momentum.
How These Levels Are Calculated
CPR uses basic formulas. Pivot is the average of high, low, and close. BC is the midpoint between high and low. TC is the pivot adjusted above BC. These calculations repeat daily.
How to Calculate CPR in Trading
CPR calculation depends on previous session values. Traders gather high, low, and close, compute the pivot, and then derive BC and TC. These levels get plotted on charts before the new session begins. The formula remains constant across all markets.
CPR Formula with Example
Suppose a stock had a High of 200, a Low of 180, and a Close of 190. Pivot = 190. BC = 190. TC = 190. This creates a narrow CPR, hinting at strong movement potential in the next session.
Step-by-Step Calculation Using the Previous Day’s Data
- Collect high, low, and close.
- Compute pivot.
- Compute BC.
- Compute TC.
- Plot all three on the chart.
How to Use CPR in Charting Tools like TradingView
TradingView offers CPR tools through built-in scripts. Users of Indian trading platforms apply CPR via custom studies or pivot tools. These platforms automatically highlight CPR zones once the parameters are entered.
How to Use CPR for Intraday Trading
Intraday traders rely on CPR to identify trend boundaries, breakout potential, and reversal zones. Each CPR layer provides a clear reaction point for price. When combined with volume or price action, CPR improves clarity during fast market sessions.
Identifying Support and Resistance Zones
TC acts like a ceiling. BC acts like a floor. Price behavior near these lines helps traders anticipate possible reversals or continuations.
Trend Identification Using CPR Width
Narrow CPR shows momentum buildup. Wide CPR shows balanced movement. Traders use this information to choose breakout or range strategies.
Breakout and Reversal Trading Strategies
Breakouts occur when the price crosses TC or BC with strength. Reversals appear when the price of the stock rejects these boundaries with strong pushback.
CPR as a Confluence with Other Indicators (VWAP, EMA, RSI)
When CPR aligns with Volume-Weighted Average Price (VWAP), Exponential Moving Average (EMA), or the Relative Strength Index (RSI), traders gain more confidence. Confluence confirms direction, reduces uncertainty, and improves decision quality.
Types of CPR Formations and Their Meaning
Different CPR layouts reflect varying market conditions. Traders interpret these formations to anticipate volatility, trend continuation, or range behavior. Narrow CPR often sets the stage for fast moves. Wide CPR points toward calmer sessions.
Narrow CPR – Indication of High Volatility or Breakout
A compressed range indicates tension. Markets often make a decisive move after narrow CPR days.
Wide CPR – Indication of Range-Bound Market
A broad range indicates balanced sentiment. Price usually oscillates within this zone.
CPR Overlap Bullish and Bearish Patterns
When new CPR forms above the previous CPR, traders treat it as bullish. When it forms below the previous CPR, the sentiment shifts downward.
CPR Trading Strategies for Beginners
Novice traders use CPR to simplify decision-making. CPR strategies focus on the relationship between price and CPR boundaries. These setups help traders remain systematic and avoid emotional decisions. The strategies revolve around breakout behavior, pullbacks, price action, and confluence with moving averages.
CPR Breakout Strategy
When the price opens above TC and sustains, traders focus on upward continuation. When price opens below BC and sustains, momentum expands downward.
CPR Pullback Strategy
Pullback entries form when price revisits TC or BC before continuing in the same direction.
CPR + Price Action Confirmation
Candlestick rejections, engulfing patterns, or strong continuation candles near CPR strengthen analysis.
CPR + Moving Average Combination
Moving averages show trend direction. CPR levels show reaction points. Together, they create clarity during intraday execution.
Advantages of Using CPR Indicator
CPR offers a balanced mix of simplicity and insight. It works across all markets and helps traders quickly read reactions. Its structure reduces confusion and keeps decision-making grounded. CPR also helps traders avoid overreliance on multiple indicators and keeps charts clean.
Simple Yet Effective for Intraday and Swing Trading
Traders appreciate CPR because it uses straightforward formulas and provides solid guidance.
Works Well Across Stocks, Indices, and Commodities
CPR adapts easily to any instrument because it is based on pure price behavior.
Helps Filter False Breakouts
When CPR boundaries align with strong candles, traders gain more confidence that moves are genuine.
Limitations of the CPR Indicator
CPR performs better when markets show a clear direction. During dull or sideways sessions, CPR may prove to be less informative. Because price keeps shifting within narrow ranges, signals become less reliable.
Works Best in Trending Markets
Directional markets reveal CPR’s strengths. Moves become more predictable when sentiment is clear.
May Give False Signals in Sideways Markets
Sideways markets produce hesitation near CPR lines. Traders use extra indicators to improve clarity.
Should Be Used with Volume and Other Indicators
Volume confirms strength. Additional indicators refine direction. CPR works best as part of a broader analysis method.
Tools and Platforms to Apply CPR
Most charting platforms help traders use CPR through built-in or custom scripts. TradingView offers a straightforward interface for CPR plotting. Indian users apply CPR using pivot tools or third-party plug-ins. Automated trading systems also include CPR logic due to their rule-based nature.
TradingView and CPR Indicators
TradingView hosts several CPR tools uploaded by community developers. Users customize colors and line visibility for clarity.
Using CPR with Automated or Algo Trading Systems
Algo traders use CPR for breakout and pullback rule creation. CPR’s formula-based structure helps automation frameworks.
Conclusion
CPR in Trading gives traders a consistent reference point for support, resistance, and trend behavior. It simplifies analysis, keeps traders focused, and enhances clarity during volatile intraday sessions. Its daily structure reflects market balance in a clean and objective format.
Key Takeaways on Using CPR in Trading
CPR forms a structured range that guides traders through price reactions. Its boundaries help identify breakouts, reversals, and continuation patterns.
How CPR Can Enhance Trading Accuracy
When used with confirmation tools, CPR strengthens clarity. Traders observe reactions near CPR levels to judge momentum and direction. This improves accuracy and steadiness during intraday sessions.
FAQs on CPR in Trading
Q. What does CPR stand for in trading?
CPR stands for Central Pivot Range.
Q. How is CPR calculated for intraday trading?
CPR uses the previous day’s high, low, and close to compute Pivot, TC, and BC.
Q. What does a narrow CPR indicate?
A narrow CPR signals volatility buildup and breakout potential.
Q. Is CPR suitable for swing trading or only intraday?
CPR works with both intraday analysis and short-term swing setups.
Q. Which time frame works best for CPR analysis?
Daily CPR plotted on intraday charts provides the clearest view.
Q. How to combine CPR with other indicators for better accuracy?
Traders pair CPR with VWAP, EMAs, RSI, or volume for stronger confluence.
Disclaimer
The stocks mentioned in this article are not recommendations. Please conduct your own research and due diligence before investing. Investment in securities market are subject to market risks, read all the related documents carefully before investing. Please read the Risk Disclosure documents carefully before investing in Equity Shares, Derivatives, Mutual fund, and/or other instruments traded on the Stock Exchanges. As investments are subject to market risks and price fluctuation risk, there is no assurance or guarantee that the investment objectives shall be achieved. Lemonn (Formerly known as NU Investors Technologies Pvt. Ltd) do not guarantee any assured returns on any investments. Past performance of securities/instruments is not indicative of their future performance.
Related Posts


Download Lemonn
Download my app for share market trading, ipo investment, trading account, and all your investment needs.


