
What Is Trading Volume, and Why It Matters in Technical Analysis
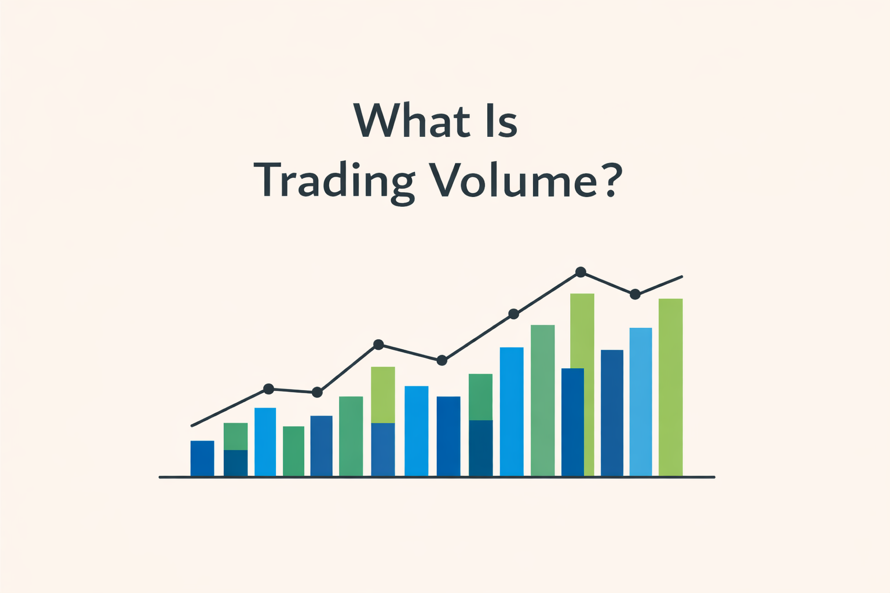
What Is Trading Volume?
Markets are constantly moving. Prices rise. Prices fall. Charts redraw themselves minute by minute. Yet beneath every tick lies a deeper force – participation. Without participation, price has no strength. Without participation, trends collapse. Participation is measured through trading volume.
Trading volume represents the total number of shares, contracts, or units that change hands within a specific time period. It measures activity. It measures engagement. It measures how intensely market participants are committing capital.
Every transaction adds to volume. Every matched order reflects agreement between a buyer and a seller. That agreement may be calm or urgent. Strategic or reactive. Small or institutional. Volume captures it all.
Price tells you where the market moved.
Trading volume tells you how strongly the market believed in that move.
A rally on thin volume often lacks durability. A breakout backed by surging volume carries weight. A sudden spike in price without participation can reverse just as quickly as it appeared. But when price and volume expand together, conviction builds.
In technical analysis, volume is not decoration beneath the chart. It is confirmation. It is evidence. It is market intent quantified.
How Does Trading Volume Work?
Trading volume increases whenever buyers and sellers execute trades. That seems straightforward. Yet the mechanics beneath that simplicity are complex.
Volume expands when uncertainty rises. It surges during earnings announcements. It accelerates during macroeconomic releases. It spikes during breakouts and collapses during periods of indecision. Volume is reactive. It mirrors emotion and information flow in real time.
Understanding how trading volume behaves requires observing its structural patterns.
“Start investing with confidence! Explore
0 demat account
and grow your wealth.”
1. Volume reflects market interest
When trading volume expands significantly above its average, it signals heightened interest. Market participants are paying attention. Capital is moving with purpose.
Institutional investors leave visible footprints in volume. When large funds accumulate or distribute positions, transaction counts rise materially. Their involvement changes the texture of trading.
Conversely, low volume reflects hesitation. It suggests limited commitment. Moves in thin volume environments often struggle to maintain direction because participation remains narrow.
Volume is the pulse of engagement. When it strengthens, the market’s heartbeat accelerates.
2. Volume changes throughout the day
Intraday volume is rarely uniform. In equity markets, the opening hour typically records intense trading volume. Overnight developments are absorbed. Orders queued from prior sessions are executed. Algorithms activate.
Midday trading often softens. Activity slows. Spreads stabilize.
Then comes the final hour. Institutional adjustments intensify. Portfolio managers rebalance. Traders close positions. Volume rises again.
A breakout during peak activity carries credibility. A breakout during midday stagnation carries uncertainty. Timing changes interpretation. Volume is not just about how much – it is about when.
3. Volume differs across assets
Trading volume varies widely across asset classes and market capitalizations. Large-cap stocks trade in massive quantities daily. Small-cap stocks may trade modest volumes, amplifying volatility. Derivatives markets concentrate volume around expiration cycles. Crypto markets distribute participation globally across time zones.
Absolute numbers lack meaning without context. Analysts examine relative volume – comparing current volume to historical averages. When a stock trades two or three times its normal volume, the deviation signals a structural change.
Volume gains meaning through comparison.
Trading Volume Example
Consider an asset trading at ₹900.
On Monday, it rises to ₹950 with 2 lakh shares traded. On Tuesday, it climbs to ₹1,020 with 12 lakh shares traded. The price increase on Tuesday carries far greater conviction. Participation expanded sixfold. Capital commitment intensified.
Now consider Wednesday. Price edges to ₹1,040 but volume drops to 1.5 lakh shares. Momentum narrows. Interest fades. The advance becomes fragile.
Volume transforms price interpretation.
| Session | Closing Price | Trading Volume | Insight |
|---|---|---|---|
| Monday | ₹950 | 2 lakh | Limited strength |
| Tuesday | ₹1,020 | 12 lakh | Strong conviction |
| Wednesday | ₹1,040 | 1.5 lakh | Weak continuation |
The numbers show more than movement. They show endorsement. High trading volume during decisive moves signals belief. Low volume during continuation signals hesitation.
How Traders Read Trading Volume
Professional traders analyze the interaction between price and volume with precision. The relationship between the two often determines trade selection.
Rising price with rising volume
When price advances alongside rising trading volume, buyers dominate with conviction. Participation expands as price climbs. Breakouts above resistance levels supported by volume spikes often indicate accumulation.
The alignment signals demand strength. Momentum builds. Continuation becomes more probable.
Rising price with falling volume
A rising price accompanied by contracting volume introduces caution. Participation shrinks even as price advances. Fewer traders support the move.
This divergence often signals weakening momentum. Trends may slow. Consolidation may emerge. Volume contraction exposes fragility beneath surface gains.
Falling price with rising volume
When price declines sharply on elevated trading volume, selling pressure intensifies. Distribution may be underway. Institutional exits may accelerate.
Heavy downside volume confirms urgency. It reflects decisive capital movement rather than gradual repositioning.
Falling price with falling volume
Declining prices paired with falling volume indicate fading selling pressure. Participation diminishes. The intensity of the decline weakens.
In certain contexts, this setup precedes stabilization. Exhaustion emerges when sellers lose momentum.
Volume patterns refine directional assessment. They do not replace trend analysis but strengthen its reliability.
Why Trading Volume Matters
Trading volume plays multiple strategic roles within technical frameworks.
It confirms price moves
Price breakouts require validation. Rising trading volume provides that validation. Without volume expansion, breakouts risk becoming temporary spikes.
Confirmation separates conviction from noise.
It affects liquidity
High trading volume enhances liquidity. Liquid markets reduce slippage. Orders execute efficiently. Position sizing becomes manageable.
Low-volume markets introduce friction. Spreads widen. Execution risk increases.
Liquidity shapes practical trade management.
It reveals participation
Volume quantifies the number of participants who support a move. Broad participation strengthens trends. Narrow participation increases vulnerability.
Participation determines resilience.
It supports timing decisions
Many traders require volume confirmation before executing trades. A resistance breakout without increased volume may be disregarded. A breakout supported by volume expansion may trigger immediate positioning.
Volume sharpens timing precision.
Trading Volume vs Liquidity
Although interrelated, trading volume and liquidity represent distinct dimensions.
| Dimension | Trading Volume | Liquidity |
|---|---|---|
| Primary Focus | Activity level | Execution efficiency |
| Measurement | Number of units traded | Depth and spread |
| Impact | Signals interest | Reduces trading friction |
High trading volume often correlates with liquidity, but liquidity depends on order book structure as well. Volume measures intensity. Liquidity measures smoothness.
Understanding the distinction improves strategic planning.
Limitations of Trading Volume
Despite its importance, trading volume has constraints.
First, it does not indicate directional bias independently. Elevated volume may reflect aggressive buying or aggressive selling.
Second, algorithmic trading can inflate volume without long-term conviction.
Third, thin markets may generate misleading spikes due to isolated large trades.
Fourth, volume interpretation requires historical benchmarking. Context defines relevance.
Volume enhances clarity but does not eliminate uncertainty. It must be integrated with structural analysis – trendlines, moving averages, support and resistance, volatility assessment.
Volume confirms participation. Structure confirms probability.
Conclusion
Trading volume is the market’s intensity indicator. It measures participation. It validates conviction. It transforms price from movement into meaning.
Strong trends typically emerge with expanding volume. Weak trends often develop in narrowing participation. Breakouts gain credibility when volume accelerates. Reversals gain clarity when participation shifts.
Volume alone does not dictate direction. Yet without volume, price lacks foundation.
In technical analysis, direction matters.
Conviction sustains it.
FAQs:
Q. Why is volume important in technical analysis?
Volume gives context to price. It shows whether a move has broad participation or limited support. When price changes occur alongside strong trading volume, the move carries greater credibility. Without volume confirmation, breakouts and reversals may lack durability.
Q. What is good trading volume?
Good trading volume is relative, not absolute. It refers to an activity that is meaningfully higher than the asset’s historical average. Consistently strong volume improves liquidity, reduces execution risk, and signals sustained market interest.
Q. What is the 80% rule in volume profile?
The 80% rule in volume profile suggests that if price re-enters the previous day’s value area and remains there for two consecutive 30-minute periods, there is a high probability that price will traverse toward the opposite side of that value area. It is used to assess auction-style market behavior.
Q. Is high volume always a bullish signal?
High volume is not automatically bullish. It signals strong participation, which can occur during aggressive buying or aggressive selling. Volume must be interpreted alongside price direction to determine whether buyers or sellers are in control.
Disclaimer
The stocks mentioned in this article are not recommendations. Please conduct your own research and due diligence before investing. Investment in securities market are subject to market risks, read all the related documents carefully before investing. Please read the Risk Disclosure documents carefully before investing in Equity Shares, Derivatives, Mutual fund, and/or other instruments traded on the Stock Exchanges. As investments are subject to market risks and price fluctuation risk, there is no assurance or guarantee that the investment objectives shall be achieved. Lemonn (Formerly known as NU Investors Technologies Pvt. Ltd) do not guarantee any assured returns on any investments. Past performance of securities/instruments is not indicative of their future performance.
Related Posts

Download Lemonn
Download my app for share market trading, ipo investment, trading account, and all your investment needs.


