
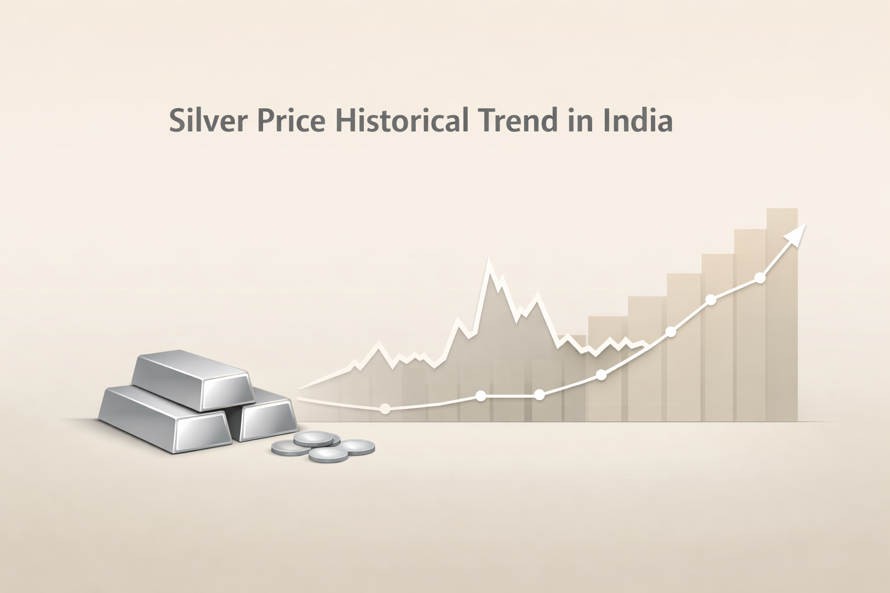
Silver Price Historical Trend in India: What You Should Know
Introduction
Silver has always been an important asset in India, valued for both cultural and investment purposes. Over the decades, its price has seen steady growth along with periods of sharp volatility.
From just around ₹100 per kg in the 1950s to nearly ₹80,000–₹90,000 in recent years, silver reflects global economic trends, currency movements, and rising industrial demand. In early 2026, prices have shown a short-term dip after recent highs, driven by profit booking and global market corrections.
Understanding this long-term trend helps investors make better decisions.
Silver Price Trend in India: Quick Summary
- Silver prices rose from ₹100/kg in 1950 to ~₹80,000–₹90,000/kg today
- Strong long-term growth with periodic volatility
- Major spikes during economic crises
- Increasing role of industrial demand (solar, EVs, electronics)
- Silver generally keeps pace with inflation
- Recent dip in 2026 reflects short-term correction, not trend reversal
“Start investing with confidence! Explore
0 demat account
and grow your wealth.”
Key Insight
Silver combines precious metal value with industrial demand, making it more volatile but offering strong long-term potential.
Historical Silver Price Trend in India (1950 to 2026)
| Year | Price (₹/kg) | Key Insight |
|---|---|---|
| 1950 | ₹100 | Very low demand |
| 1960 | ₹120 | Slow growth |
| 1970 | ₹180 | Gradual rise |
| 1980 | ₹1,300 | First major spike |
| 1990 | ₹6,500 | Inflation impact |
| 2000 | ₹7,500 | Stable phase |
| 2010 | ₹18,000 | Demand increases |
| 2011 | ₹56,000 | Sharp spike |
| 2015 | ₹35,000 | Correction |
| 2020 | ₹65,000 | Pandemic surge |
| 2022 | ₹62,000 | Slight dip |
| 2023 | ₹75,000 | Recovery |
| 2024 | ₹80,000 | Strong demand |
| 2025 | ₹85,000 | Growth continues |
| 2026 | ₹78,000–₹90,000* | Volatility with dip |
*Indicative range based on market trends.
Note: Prices are approximate averages.
Silver Prices Adjusted for Inflation (Real Value in 2026)
| Year | Nominal Price (₹/kg) | Inflation-Adjusted (2026 ₹) | Insight |
|---|---|---|---|
| 1950 | ₹100 | ₹8,000 | Low real value |
| 1960 | ₹120 | ₹7,500 | Limited growth |
| 1970 | ₹180 | ₹8,200 | Stable |
| 1980 | ₹1,300 | ₹12,000 | First real jump |
| 1990 | ₹6,500 | ₹28,000 | Strong rise |
| 2000 | ₹7,500 | ₹22,000 | Flat phase |
| 2010 | ₹18,000 | ₹35,000 | Growth begins |
| 2011 | ₹56,000 | ₹90,000 | Peak |
| 2015 | ₹35,000 | ₹50,000 | Correction |
| 2020 | ₹65,000 | ₹75,000 | Recovery |
| 2023 | ₹75,000 | ₹80,000 | Stable |
| 2026 | ₹80,000 | ₹80,000 | Cooling phase |
Silver Price Trend in 2026 (Month-Wise Data Till Date)
Silver prices in 2026 started strong but have recently entered a correction phase after early highs.
| Month (2026) | Avg Price (₹/kg) | Trend |
|---|---|---|
| January | ₹82,000 | Strong start |
| February | ₹85,000 | Uptrend continues |
| March | ₹88,000 | Peak levels |
| April (till Apr 9) | ₹83,000–₹84,500 | Correction phase |
What This Shows
- Silver reached its peak in March 2026 (~₹88,000/kg)
- Prices started correcting in April 2026
- Current movement shows early signs of a dip after a strong rally
Why Prices Are Falling Now
- Profit booking after rapid price increase
- Slight slowdown in global industrial demand
- Dollar strength impacting commodity prices
- Market consolidation after peak levels
Key Insight
The current dip is short-term and typical after a strong rally. Historically, silver often corrects before continuing its long-term upward trend.
What Drives Silver Prices in India?
1. Global Spot Prices
Indian prices follow international markets.
2. Rupee vs. Dollar
A weaker rupee increases silver prices.
3. Inflation and Economic Uncertainty
Demand rises during uncertain times.
4. Industrial Demand
Used in:
- Solar panels
- Electronics
- Electric vehicles
5. Festivals and Cultural Demand
Demand increases during weddings and festivals.
Decade-Wise Overview: Silver Prices in India
1950s-1970s: Low but Steady
Stable prices with limited demand.
1980s: Price Spike
Sharp increase due to global factors.
1990s: Range-Bound
Moderate and stable movement.
2000s: Gradual Uptick
Steady growth phase.
2010-2020: Volatility and Record Highs
Major spikes in 2011 and 2020.
2021-2026: Aggressive Growth with Recent Dip
Strong growth followed by a short-term correction in 2026 due to:
- Profit booking
- Global slowdown concerns
- Demand fluctuations
Should You Invest in Silver Now?
Silver remains a strong option in 2026.
Pros
- Affordable compared to gold
- Strong industrial demand
- Portfolio diversification
Cons
- High volatility
- Short-term price dips
Smart Strategy
- Invest gradually
- Focus on long-term trends
Gold vs Silver Returns in India (Long-Term Comparison)
Decade-Wise Performance
| Period | Gold Price(10g) (Approx) | Silver Price(1Kg) (Approx) | Return Trend | Key Insight |
|---|---|---|---|---|
| 1950–1980 | ₹100 → ₹1,800 | ₹100 → ₹1,300 | Gold ↑↑ | Gold stronger |
| 1980–2000 | ₹1,800 → ₹4,400 | ₹1,300 → ₹7,500 | Silver ↑↑ | Volatile spikes |
| 2000–2010 | ₹4,400 → ₹18,500 | ₹7,500 → ₹18,000 | Both ↑↑ | Strong growth |
| 2010–2020 | ₹18,500 → ₹50,000 | ₹18,000 → ₹65,000 | Silver ↑↑↑ | High volatility |
| 2020–2026 | ₹50,000 → ₹65,000+ | ₹65,000 → ₹80,000 | Silver ↑↑ | Driven by industry |
Long-Term Returns Snapshot
| Asset | 1950 Price | 2026 Price | Growth | CAGR |
|---|---|---|---|---|
| Gold | ₹100 (10g) | ₹65,000+ | ~650x | ~9–10% |
| Silver | ₹100 (kg) | ₹80,000+ | ~800x | ~10–11% |
What This Means
- Silver offers higher returns but more volatility
- Gold offers stability and lower risk
- A mix of both balances a portfolio
Key Takeaways
- Silver prices show strong long-term growth
- Industrial demand is a major driver
- Silver acts as a partial inflation hedge
- 2026 dip is a temporary correction
- Long-term outlook remains positive
FAQs on Silver Price History in India
Q. Has silver outperformed inflation over time?
Silver generally keeps pace with inflation, with stronger gains during high-demand periods.
Q. Should I buy silver now or wait?
Gradual investing is better than timing the market.
Q. Is silver better than gold in 2026?
Silver offers higher growth, while gold provides more stability.
Disclaimer
The stocks mentioned in this article are not recommendations. Please conduct your own research and due diligence before investing. Investment in securities market are subject to market risks, read all the related documents carefully before investing. Please read the Risk Disclosure documents carefully before investing in Equity Shares, Derivatives, Mutual fund, and/or other instruments traded on the Stock Exchanges. As investments are subject to market risks and price fluctuation risk, there is no assurance or guarantee that the investment objectives shall be achieved. Lemonn (Formerly known as NU Investors Technologies Pvt. Ltd) do not guarantee any assured returns on any investments. Past performance of securities/instruments is not indicative of their future performance.
Related Posts

Download Lemonn
Download my app for share market trading, ipo investment, trading account, and all your investment needs.


