
P/E vs P/B vs EV/EBITDA vs ROIC: When Each Stock Valuation Metric Actually Matters
Why One Metric Is Never Enough
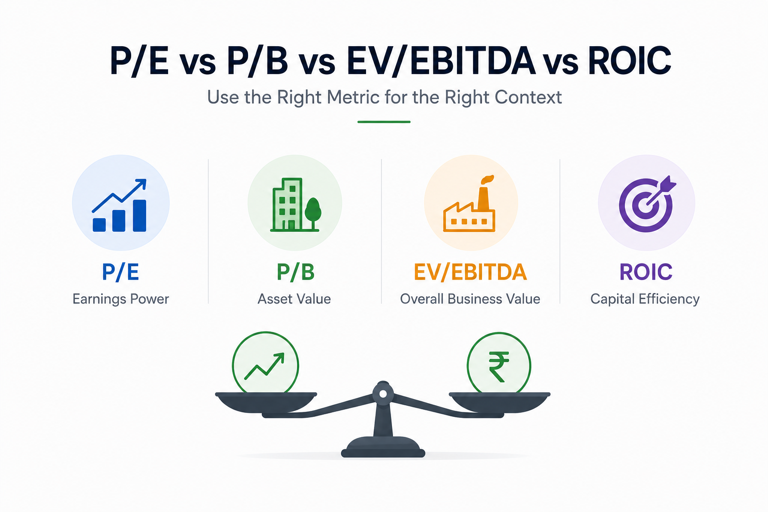
Each stock valuation metric captures a different dimension of a company’s value. A single metric can be misleading — a low P/E stock may be cheap because earnings are about to collapse; a high P/E stock may be cheap relative to its growth rate. Sophisticated investors triangulate across multiple metrics to build conviction.
Price-to-Earnings (P/E)
| Aspect | Detail |
|---|---|
| Formula | Market Price / Earnings Per Share |
| Best for | Profitable companies with stable earnings: FMCG, IT, banks (with some adjustment) |
| Watch out for | Cyclical stocks at earnings peak (seems cheap but earnings will fall); loss-making companies (no P/E) |
| India benchmark | Nifty 50 trades at 20–25x historically; below 18x = cheap; above 28x = expensive |
“Start investing with confidence! Explore
0 demat account
and grow your wealth.”
Price-to-Book (P/B)
| Aspect | Detail |
|---|---|
| Formula | Market Price / Book Value per Share |
| Best for | Banks, NBFCs, holding companies (asset-heavy) |
| Watch out for | Intangible-heavy businesses (IT, FMCG) have low book value — P/B seems high but is misleading |
| India benchmark | Banks: 1x–3x is reasonable; PSU banks at 0.5–1x P/B may signal deep value or structural problem |
EV/EBITDA
| Aspect | Detail |
|---|---|
| Formula | Enterprise Value / EBITDA (Earnings before interest, tax, depreciation) |
| Best for | Capital-intensive companies; comparing companies with different debt levels; M&A analysis |
| Watch out for | High depreciation businesses (capex-heavy) may look cheap on EV/EBITDA but actual cash returns are lower |
| India benchmark | Consumer discretionary: 15–25x; IT services: 12–20x; Infrastructure/Utilities: 8–15x |
ROIC (Return on Invested Capital)
ROIC = EBIT(1-tax) / (Equity + Debt – Cash). ROIC tells you how much return the company generates on all capital invested. A company with ROIC consistently above 15% and growing is allocating capital excellently. ROIC above its cost of capital (WACC) = value creation. Below WACC = value destruction. This is the single most important metric for evaluating management quality.
Sector-Specific Metric Cheatsheet
| Sector | Primary Metric | Secondary Metric | Avoid |
|---|---|---|---|
| Banks/NBFCs | P/B + ROE | NIM, NPA% | P/E (distorted by provisioning) |
| IT Services | P/E + EV/EBITDA | Revenue growth, EBIT margin | P/B (low book value misleads) |
| FMCG | P/E + EV/EBITDA | Gross margin, volume growth | P/B (brand value not on balance sheet) |
| Infrastructure/Utilities | EV/EBITDA | Order book, D/E | P/E (depreciation distorts) |
| Real Estate | NAV premium/discount | Pre-sales, collections | P/E (accounting doesn’t reflect cash) |
| Capital Goods | P/E + Order book to sales | ROCE | EV/EBITDA alone |
Disclaimer
The stocks mentioned in this article are not recommendations. Please conduct your own research and due diligence before investing. Investment in securities market are subject to market risks, read all the related documents carefully before investing. Please read the Risk Disclosure documents carefully before investing in Equity Shares, Derivatives, Mutual fund, and/or other instruments traded on the Stock Exchanges. As investments are subject to market risks and price fluctuation risk, there is no assurance or guarantee that the investment objectives shall be achieved. Lemonn (Formerly known as NU Investors Technologies Pvt. Ltd) do not guarantee any assured returns on any investments. Past performance of securities/instruments is not indicative of their future performance.
Related Posts


Download Lemonn
Download my app for share market trading, ipo investment, trading account, and all your investment needs.


