
MSCI Rejig Drives $4.2 Billion Turnover in NSE CAS
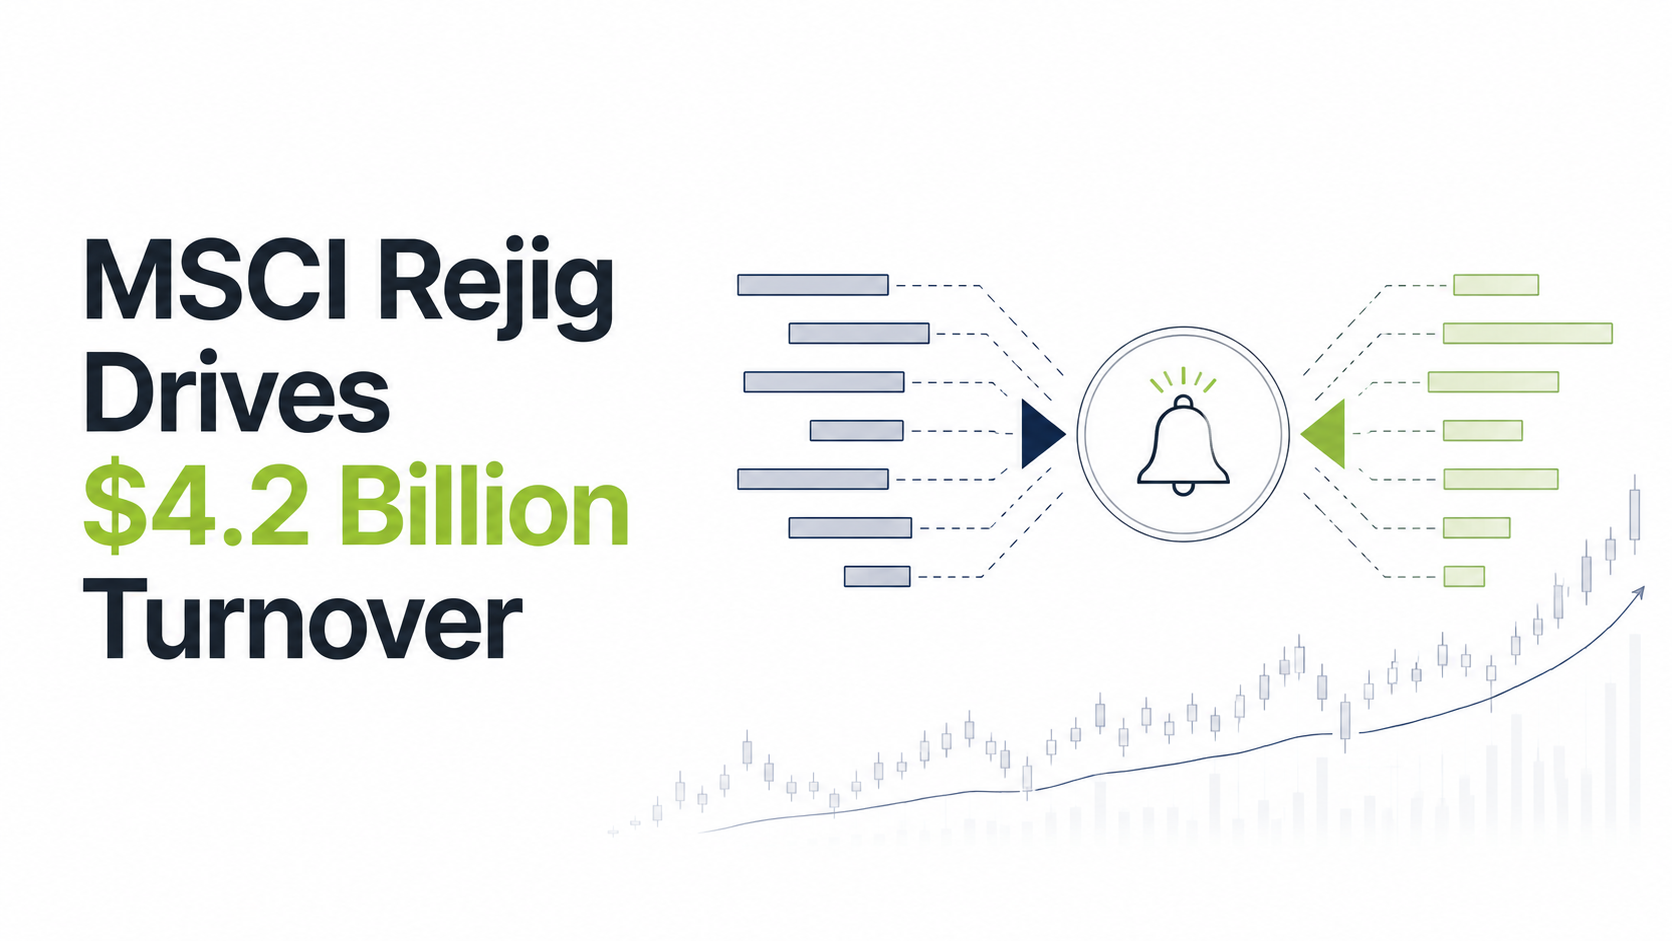
MSCI’s latest India index rebalancing delivered the biggest test yet for the country’s new Closing Auction Session (CAS). The NSE auction handled about $4.2 billion, or ₹39,718 crore, of trades, but the surge in liquidity did not prevent sharp price swings in individual stocks.
CAS accounted for roughly 22% of the NSE’s total cash-market turnover during the August 31 session. More than 98,000 unique investors participated, while turnover was about 42 times higher than in the previous trading session, according to NSE data cited by Moneycontrol.
The numbers show that CAS can process exceptionally large index-related flows. They also highlight an important weakness: liquidity and price stability can vary significantly from one stock to another.
What Happened During the MSCI India Rebalancing?
MSCI periodically reviews its indices to reflect changes in market capitalisation, liquidity and other eligibility factors.
The August 2026 review added Laurus Labs, Lenskart Solutions, Adani Energy Solutions and Billionbrains Garage Ventures, Groww’s parent company, to the MSCI India Index. Astral, Balkrishna Industries and SBI Cards and Payment Services were removed.
The changes became effective from September 1.
Passive funds and other investors tracking MSCI benchmarks therefore had to adjust their portfolios around the August 31 close.
That concentrated a large amount of buying and selling into India’s new closing auction mechanism.
What Is the Closing Auction Session?
The Closing Auction Session, or CAS, is a roughly 20-minute auction near the end of the trading day that matches buy and sell orders to establish closing prices for eligible stocks.
India introduced the mechanism in August 2026.
The basic idea is to move closing-price formation away from a narrow snapshot of continuous trading and into an auction where orders can be pooled and matched.
This becomes particularly important on index-rebalancing days.
Passive funds often need to execute substantial trades close to the official closing price because their portfolios are designed to track an index as closely as possible.
“Start investing with confidence! Explore
0 demat account
and grow your wealth.”
How Big Was the $4.2 Billion CAS Turnover?
The MSCI rebalance caused an extraordinary jump in closing-auction activity.
| CAS metric | August 31 session |
|---|---|
| NSE CAS turnover | ₹39,718 crore |
| Approximate dollar value | $4.2 billion |
| Share of NSE cash turnover | About 22% |
| Total NSE cash turnover | ₹1.81 trillion |
| Unique CAS investors | 98,000+ |
| Previous session CAS turnover | ₹945 crore |
Sources: NSE data reported by Moneycontrol and Business Standard.
The contrast with a normal session is striking.
On the preceding Friday, CAS turnover on the NSE was only ₹945 crore, representing around 0.9% of total cash-market turnover. During August, CAS typically accounted for roughly 1% of NSE cash volumes.
On MSCI rebalancing day, its share jumped to roughly 22%.
Why Did MSCI Rebalancing Create So Much Trading?
The reason lies in how passive investing works.
Funds tracking an MSCI index generally need to hold stocks in proportions that closely resemble the benchmark. When MSCI adds or removes a company, or changes a company’s weight, these funds must rebalance their portfolios.
That can create three types of trades:
- Inclusions: Funds may need to buy newly added stocks.
- Exclusions: Funds may need to sell stocks removed from the index.
- Weight changes: Funds buy or sell existing constituents when their index weight changes.
The cumulative net flows associated with the latest MSCI rebalancing were estimated at around $1.4 billion, while total CAS turnover reached $4.2 billion.
Turnover is larger than net flows because it measures the total value traded rather than simply the net amount entering or leaving the market.
Which Stocks Saw the Biggest CAS Price Moves?
This is where the stress test became more interesting.
Of the 19 stocks expected to experience an addition, deletion or weight adjustment, 17 were eligible for CAS. Nine of those 17 stocks reached either the upper or lower 3% auction price band.
Some notable CAS-linked moves included:
| Stock | MSCI action | CAS-linked move |
|---|---|---|
| Laurus Labs | Inclusion | +3.0% |
| Adani Energy Solutions | Inclusion | -3.0% |
| SBI Cards | Exclusion | -3.0% |
| Astral | Exclusion | -3.0% |
| Eternal | Weight increase | +3.0% |
| Adani Enterprises | Weight increase | -3.0% |
| Adani Ports | Weight increase | -3.0% |
| Indian Hotels | Weight decrease | +3.0% |
| Colgate-Palmolive India | Weight decrease | +3.0% |
Source: Moneycontrol, based on Bloomberg and market data.
The direction of these moves is worth noting. A stock’s MSCI action does not necessarily determine its immediate auction price direction.
A weight increase, for example, does not guarantee a price gain during CAS. Existing positioning, arbitrage trades, order-book liquidity and the imbalance between buyers and sellers can all influence the final price.
Why Did Volatility Surge Despite Record Liquidity?
At first glance, $4.2 billion of turnover might suggest that the auction had plenty of liquidity.
But high aggregate turnover is not the same as deep liquidity in every individual stock.
That distinction explains much of the volatility.
Passive funds often have limited flexibility on index-rebalancing days. They need to complete trades so that their portfolios reflect the revised benchmark.
If there are not enough sellers at the required time, a fund buying shares may have to submit orders at progressively higher prices to improve the probability of execution.
The opposite happens when large amounts of stock need to be sold into limited demand.
This imbalance can push individual stocks toward the CAS price limits even when overall market turnover is extremely high.
How Well Did CAS Absorb the MSCI Flows?
The answer varied considerably by stock.
In several cases, CAS volumes were actually higher than the estimated volumes required to execute the MSCI rebalance.
| Stock | CAS volume as % of estimated rebalance requirement |
|---|---|
| Adani Power | 160% |
| GMR Airports | 134% |
| Adani Ports | 132% |
| Adani Energy Solutions | 122% |
| Adani Enterprises | 120% |
| Swiggy | 113% |
| Eternal | 99% |
| SBI Cards | 89% |
| Laurus Labs | 75% |
| Lenskart Solutions | 73% |
Source: Moneycontrol, using estimates from Nuvama Alternative & Quantitative Research.
These figures suggest that the auction was capable of handling substantial index-related volumes.
But execution was far less complete in some counters.
Where Was CAS Liquidity Weaker?
Colgate-Palmolive India recorded CAS volumes equivalent to only about 33% of its estimated rebalancing requirement.
Other relatively low figures included:
- Indian Hotels: 49%
- JSW Energy: 48%
- Jio Financial Services: 54%
- Reliance Industries: 70%
That dispersion is important.
A closing auction can look extremely liquid when measured across the whole exchange while still having thin or imbalanced order books in particular stocks.
What Do 60 Stocks Hitting Price Bands Tell Us?
The volatility extended beyond companies directly affected by the MSCI review.
Moneycontrol reported that 60 of the 210 stocks eligible for CAS reached their auction price bands, with 47 hitting the upper 3% band.
That suggests the issue was broader than a handful of MSCI constituents.
Bloomberg also highlighted concerns around the absence of market makers, arguing that additional liquidity providers could help reduce sharp closing-price swings as India’s auction system develops.
For exchanges and regulators, the next question is therefore not simply whether CAS can handle large volumes.
It is whether those volumes can consistently produce efficient price discovery without disproportionate stock-level volatility.
Was the First Major CAS Stress Test Successful?
The outcome was mixed, but significant.
On the positive side, the infrastructure processed close to ₹40,000 crore of trades during a highly concentrated index-rebalancing event. Reports indicated that the session itself operated smoothly despite the surge in activity.
That is an important operational test for a mechanism introduced only in August.
The weakness was price stability.
Nine of 17 MSCI-affected stocks eligible for CAS reached their 3% auction bands, while dozens of other eligible stocks also touched their limits.
So, CAS demonstrated capacity, but questions remain about liquidity distribution and price discovery.
What Does the MSCI Rejig Mean for Retail Investors?
Retail investors should distinguish between index-driven price moves and changes in a company’s fundamentals.
MSCI rebalancing can produce unusually large buying or selling pressure because passive funds are mechanically adjusting their holdings.
A stock can therefore move sharply near the close without any corresponding change in earnings, revenue, debt or business prospects.
For investors, three points matter:
- Expect more volatility around index changes. Inclusion, exclusion and weight changes can generate concentrated institutional orders.
- Do not assume an inclusion guarantees a price rise. Adani Energy Solutions, for example, experienced a negative CAS-linked move despite being included in the MSCI India Index.
- Treat closing prices carefully on major rebalance days. Auction imbalances can temporarily have a large influence on price formation.
Short-term traders face an additional risk because auction behaviour may differ considerably from normal continuous trading.
Why CAS Matters for India’s Capital Markets
Closing auctions are particularly relevant as India’s equity market attracts more domestic and international passive capital.
Index funds do not necessarily care about finding the lowest possible purchase price or highest possible selling price on rebalance day. Their primary objective is often to minimise tracking error, or the difference between the fund’s performance and that of its benchmark.
This creates heavy demand for execution near official closing prices.
A well-functioning closing auction gives these investors a common venue where liquidity can concentrate.
The MSCI event suggests India’s CAS can handle substantial institutional flows. The challenge now is improving the depth and balance of individual stock order books so that high turnover translates into more stable price discovery.
What Should Investors Watch Next?
Future MSCI, FTSE and other major index rebalances will provide further tests of the closing auction mechanism.
Three indicators will be particularly useful:
CAS Share of Daily Turnover
The MSCI session’s 22% share was exceptional compared with roughly 1% on ordinary trading days in August.
Future index events will show whether this level of liquidity becomes repeatable.
Number of Stocks Hitting Auction Bands
Frequent moves to the 3% limits could indicate that individual stock order books remain too imbalanced during large institutional events.
Depth of Stock-Level Liquidity
Headline turnover matters less if liquidity is concentrated in only a small group of securities.
More balanced participation across buyers and sellers would help CAS achieve its core purpose of robust closing-price discovery.
FAQs
What was the NSE CAS turnover during the MSCI rebalance?
The NSE’s Closing Auction Session recorded ₹39,718 crore, or approximately $4.2 billion, in turnover during the August 31 MSCI rebalancing session. It represented roughly 22% of the exchange’s total cash-market turnover.
What is CAS in the Indian stock market?
CAS stands for Closing Auction Session. It is an end-of-day auction in which eligible buy and sell orders are matched to help determine stocks’ official closing prices.
Why does MSCI rebalancing affect Indian stocks?
Funds tracking MSCI indices must adjust their portfolios when stocks are added, removed or given different index weights. Those adjustments can generate large institutional buy and sell orders.
Which stocks entered the MSCI India Index in the latest rejig?
Laurus Labs, Lenskart Solutions, Adani Energy Solutions and Billionbrains Garage Ventures, the parent of Groww, were added in the August 2026 review.
Which stocks were removed from the MSCI India Index?
Astral, Balkrishna Industries and SBI Cards and Payment Services were removed from the index.
Why were stocks volatile during the closing auction?
Large index-driven orders met uneven liquidity across individual stocks. While total CAS turnover was high, buy and sell orders were not necessarily balanced in every counter, leading to sharp price movements.
Does MSCI inclusion guarantee that a stock will rise?
No. Inclusion can create passive-fund buying demand, but short-term prices also depend on expectations, existing positioning, liquidity, arbitrage activity and the balance of orders. The latest rebalance produced examples of newly included stocks moving in both directions.
Key Takeaways
- MSCI’s India index rebalancing pushed NSE CAS turnover to about $4.2 billion, or ₹39,718 crore.
- CAS accounted for roughly 22% of total NSE cash-market turnover, compared with around 1% on typical August trading days.
- More than 98,000 investors participated in the closing auction.
- Nine of the 17 MSCI-affected stocks eligible for CAS reached their 3% upper or lower auction bands.
- Stock-level liquidity varied widely, with CAS volumes ranging from about 33% to 160% of estimated MSCI rebalancing requirements for highlighted counters.
- The event showed that India’s new closing auction can process major institutional flows, but sharp individual-stock swings remain an issue to watch.
Disclaimer
The stocks mentioned in this article are not recommendations. Please conduct your own research and due diligence before investing. Investment in securities market are subject to market risks, read all the related documents carefully before investing. Please read the Risk Disclosure documents carefully before investing in Equity Shares, Derivatives, Mutual fund, and/or other instruments traded on the Stock Exchanges. As investments are subject to market risks and price fluctuation risk, there is no assurance or guarantee that the investment objectives shall be achieved. Lemonn (Formerly known as NU Investors Technologies Pvt. Ltd) do not guarantee any assured returns on any investments. Past performance of securities/instruments is not indicative of their future performance.
Related Posts

Download Lemonn
Download my app for share market trading, ipo investment, trading account, and all your investment needs.



