
What Is Market Breadth?
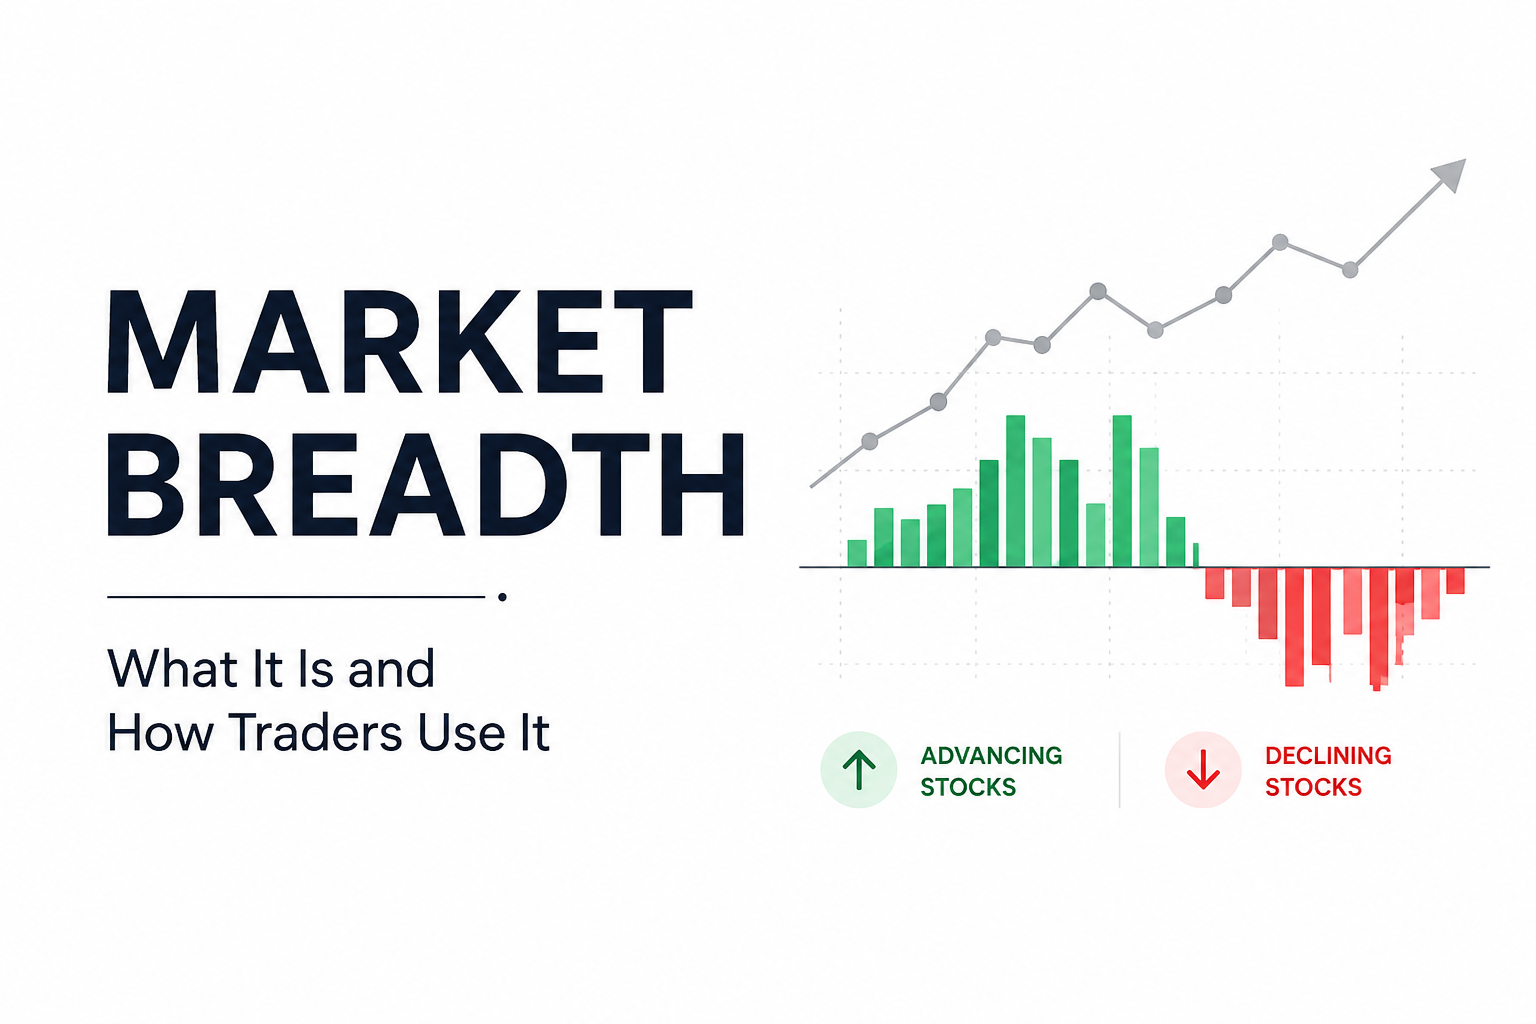
Market breadth measures how many stocks are participating in a market move. Instead of looking only at an index such as the Nifty 50 or Sensex, breadth tells traders whether the rise or fall is supported by a large number of stocks.
For example, suppose the Nifty 50 rises 1%. If 40 of its 50 stocks also rise, the rally has relatively broad participation. If only 10 stocks rise while a few heavyweight stocks push the index higher, the market may be weaker beneath the surface.
That is why traders use market breadth indicators to confirm trends, identify divergences, assess market strength, and spot potential turning points.
How Does Market Breadth Work?
A stock market index does not always give a complete picture of what is happening in the broader market.
Many indices are weighted by market capitalization or free-float market capitalization. As a result, large companies can have a much greater effect on index movements than smaller constituents.
Imagine this simplified situation:
| Market condition | Index movement | Stocks advancing | Stocks declining | Breadth signal |
|---|---|---|---|---|
| Strong rally | +1.5% | 42 | 8 | Strong |
| Narrow rally | +1.0% | 18 | 32 | Weak |
| Broad sell-off | -1.4% | 7 | 43 | Bearish |
| Index falls, breadth improves | -0.5% | 25 | 25 | Possible stabilization |
A rising index accompanied by strong breadth generally suggests that buyers are active across the market.
A rising index with deteriorating breadth deserves more attention. It means fewer stocks are participating, even though the headline index continues moving higher.
What Are the Main Market Breadth Indicators?
There is no single best market breadth indicator. Traders usually combine several measures depending on their trading style.
“Start investing with confidence! Explore
0 demat account
and grow your wealth.”
1. Advance-Decline Ratio
The advance-decline ratio, or A/D ratio, compares the number of stocks that gained with the number that declined.
The basic formula is:
Advance-Decline Ratio = Number of Advancing Stocks ÷ Number of Declining Stocks
Suppose:
- 1,200 stocks advance
- 800 stocks decline
The A/D ratio would be:
1,200 ÷ 800 = 1.5
An A/D ratio above 1 means more stocks advanced than declined. A ratio below 1 means declining stocks outnumbered advancing stocks.
The ratio is most useful when compared across several trading sessions rather than interpreted from one reading alone.
2. Advance-Decline Line
The advance-decline line, commonly called the A/D line, tracks the cumulative difference between advancing and declining stocks.
A simplified calculation is:
Today’s A/D Line = Previous A/D Line + (Advancing Stocks – Declining Stocks)
Traders then compare the direction of the A/D line with the underlying index.
If both make higher highs, the trend has broad participation. If the index reaches new highs while the A/D line fails to do so, a bearish breadth divergence may be developing.
3. Percentage of Stocks Above a Moving Average
Another useful breadth indicator measures the percentage of stocks trading above an important moving average, such as the:
- 20-day moving average
- 50-day moving average
- 200-day moving average
The 200-day measure can help assess longer-term market participation.
For instance, an index may be near an all-time high while only 45% of its constituent stocks trade above their 200-day moving averages. That tells a different story from a market where 80% of stocks are above the same average.
4. New Highs vs New Lows
This indicator compares stocks reaching fresh highs with those hitting fresh lows over a specified period, commonly 52 weeks.
A healthy bull market generally sees an expanding number of stocks making new highs.
If the index keeps rising while the number of new highs steadily falls, momentum may be becoming concentrated in fewer stocks.
5. McClellan Oscillator
The McClellan Oscillator is a more advanced breadth indicator based on the difference between exponential moving averages of market advances and declines.
Traders primarily use it to assess short-term breadth momentum and potentially overbought or oversold market conditions.
It can be useful, but traders should understand its calculation and historical behavior before incorporating it into a strategy.
How Do Traders Use Market Breadth?
Market breadth is generally more useful as a confirmation and context tool than as a standalone buy or sell signal.
Here are some of its most common applications.
Confirming an Uptrend
Suppose the Nifty 50 has been making higher highs for several weeks.
At the same time:
- The advance-decline line is rising
- Most constituent stocks are above their 50-day moving averages
- New 52-week highs are increasing
These signals suggest that the rally is supported by broad participation.
That does not guarantee that prices will continue rising, but it provides stronger confirmation than the index movement alone.
Spotting a Bearish Breadth Divergence
One of the most closely watched market breadth signals occurs when the index and breadth move in opposite directions.
For example:
- The index reaches a new high.
- Fewer stocks participate in the rally.
- The advance-decline line fails to reach a new high.
- The percentage of stocks above key moving averages starts falling.
This is called negative or bearish breadth divergence.
It suggests that the headline index remains strong while underlying participation is weakening.
A divergence is a warning, not an automatic sell signal. It can persist for some time before the index reverses.
Spotting a Bullish Breadth Divergence
The reverse can happen during a falling market.
An index may make a new low while:
- Fewer stocks make new lows
- The advance-decline line begins improving
- More stocks recover above short-term moving averages
This is known as positive or bullish breadth divergence.
It can indicate that selling pressure is becoming less widespread, although price confirmation is still important.
Identifying Broad Market Participation
Breadth can also help traders understand whether strength is concentrated in a handful of large-cap stocks or spread across the market.
This matters particularly when comparing headline indices with broader indices.
If large-cap indices are rising but mid-cap and small-cap participation is deteriorating, the market environment may be less supportive than the headline numbers suggest.
Market Breadth Example
Consider a hypothetical Nifty 50 rally.
The index moves from 24,000 to 24,800 over several sessions.
At first, 38 to 42 stocks close higher on strong sessions. Later, the index continues climbing, but only 20 to 25 stocks regularly advance.
Meanwhile, fewer constituents remain above their 50-day moving averages.
The index is still bullish based purely on price, but breadth is weakening.
A trader might respond by becoming more selective, tightening risk controls, or waiting for price confirmation instead of immediately betting against the index.
This distinction is important. Weak breadth can warn of vulnerability, but it does not tell you exactly when a reversal will occur.
Market Breadth vs Market Momentum
Market breadth and momentum answer different questions.
| Factor | Market breadth | Market momentum |
|---|---|---|
| Measures | Participation across stocks | Speed and strength of price movement |
| Main question | How many stocks support the move? | How strongly is price moving? |
| Examples | A/D line, new highs/lows | RSI, MACD, rate of change |
| Common use | Trend confirmation | Entry, exit and trend analysis |
| Best interpreted with | Price and volume | Trend and market structure |
A market can have strong index momentum but weak breadth. That combination can signal that a rally is becoming increasingly narrow.
What Is Considered Strong Market Breadth?
There is no universal number that defines strong or weak breadth across every market and indicator.
In general, traders look for consistency between price and participation.
During a healthy uptrend, they may want to see:
- More advancing stocks than declining stocks
- A rising advance-decline line
- Increasing participation above important moving averages
- More stocks approaching or making new highs
- Strength across multiple sectors
The opposite conditions can support a bearish interpretation.
Historical context matters. A breadth reading should usually be compared with its own recent range rather than treated as a fixed buy or sell threshold.
What Are the Limitations of Market Breadth?
Market breadth can provide useful information, but it has several limitations.
Breadth can weaken long before a market reverses. Selling simply because a divergence appears can result in exiting a strong trend too early.
Different universes produce different signals. Breadth calculated for the Nifty 50 may look very different from breadth across a much wider group of NSE-listed stocks.
The indicator does not predict magnitude. Weak breadth cannot tell you whether the next correction will be 2%, 10%, or something else.
Breadth is not an entry trigger by itself. Traders commonly combine it with price action, support and resistance, volume, volatility, and risk-management rules.
How Can Traders Add Market Breadth to a Trading Strategy?
A practical approach is to use breadth as a market filter rather than trying to trade every individual fluctuation.
For example, a trader could assess three things before entering a bullish trade:
- Price trend: Is the index making higher highs and higher lows?
- Breadth: Are a healthy number of stocks participating?
- Trade setup: Does the individual stock provide a defined entry and stop-loss level?
When all three point in the same direction, the trade has stronger confirmation.
When they conflict, the trader may reduce position size, demand a stronger setup, or simply avoid the trade.
Market breadth should not replace a trading plan. It adds another layer of information to it.
FAQs
Q. What does market breadth mean in simple terms?
Market breadth shows how many stocks are participating in a market rise or fall. Broad participation generally supports the strength of a trend, while narrow participation can indicate that the index is being driven by relatively few stocks.
Q. What is a good market breadth indicator?
The advance-decline line is one of the most widely used breadth indicators. Traders also monitor the advance-decline ratio, new highs versus new lows, and the percentage of stocks trading above key moving averages.
Q. Is positive market breadth bullish?
Positive breadth means more stocks are advancing than declining, which is generally bullish. However, one day’s reading is not enough to establish a trend. Traders usually examine how breadth develops over time.
Q. What does weak market breadth mean?
Weak breadth means relatively few stocks are supporting the market’s move. If an index keeps rising while breadth deteriorates, it may indicate that the rally is becoming increasingly concentrated.
Q. What is breadth divergence in trading?
Breadth divergence occurs when an index and a breadth indicator move in different directions. For example, an index making new highs while the advance-decline line makes lower highs can signal weakening participation.
Q. Can market breadth predict a market crash?
No. Market breadth cannot reliably predict a crash or the exact timing of a market reversal. Deteriorating breadth can highlight underlying weakness, but it should be considered alongside price action and other market indicators.
Q. Is market breadth useful for intraday trading?
Yes, particularly as a measure of overall market sentiment. An intraday trader can compare advancing and declining stocks to determine whether an index move has broad support. Short-term breadth readings can change quickly, so they should not be used in isolation.
Key Takeaways
- Market breadth measures how widely stocks participate in a market move.
- Strong breadth can confirm an index trend, while weakening breadth can reveal strength or weakness hidden by headline index levels.
- Common market breadth indicators include the advance-decline ratio, A/D line, new highs versus new lows, and percentage of stocks above moving averages.
- Divergence between an index and breadth can provide an early warning of changing market conditions.
- Breadth is better used for confirmation and market context than as a standalone buy or sell signal.
- Traders should combine breadth with price action, volume, trend analysis, and disciplined risk management.
Disclaimer
The stocks mentioned in this article are not recommendations. Please conduct your own research and due diligence before investing. Investment in securities market are subject to market risks, read all the related documents carefully before investing. Please read the Risk Disclosure documents carefully before investing in Equity Shares, Derivatives, Mutual fund, and/or other instruments traded on the Stock Exchanges. As investments are subject to market risks and price fluctuation risk, there is no assurance or guarantee that the investment objectives shall be achieved. Lemonn (Formerly known as NU Investors Technologies Pvt. Ltd) do not guarantee any assured returns on any investments. Past performance of securities/instruments is not indicative of their future performance.
Related Posts

Download Lemonn
Download my app for share market trading, ipo investment, trading account, and all your investment needs.



