
Technical Analysis: How Smart Traders Use Charts to Make Better Decisions
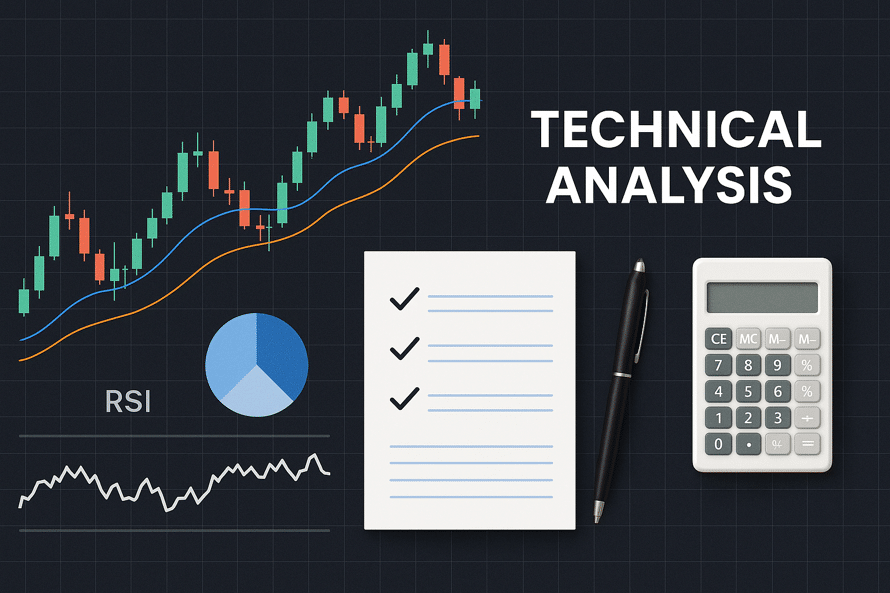
Technical analysis might sound intimidating, but at its core, it’s simply the art of reading charts to make smarter investment decisions. Instead of digging through company balance sheets or earnings reports, technical analysts focus on price trends and trading volume.
If you’ve ever looked at a stock chart and wondered what all those lines and shapes mean — you’re in the right place.
What Is Technical Analysis?
Technical analysis is a method of evaluating investments by analyzing historical price data and trading volume. It’s built on three key ideas:
- Prices reflect all available information
- Markets move in trends
- History tends to repeat itself
So rather than asking why a stock is moving, technical traders ask what’s next — based on past behavior.
This approach works across all kinds of markets: stocks, crypto, forex, commodities, and more.
How It Differs from Fundamental Analysis
Fundamental analysis looks at a company’s actual business — earnings, growth, industry trends, etc. It’s about figuring out what something is worth in the long run.
Technical analysis, on the other hand, is all about timing.
It’s used to:
- Spot trends and reversals
- Identify entry and exit points
- Set stop-loss and profit targets
Many experienced investors use both. For example, they might use fundamentals to pick a stock, and technicals to decide when to buy or sell it.
“Start investing with confidence! Explore
0 demat account
and grow your wealth.”
Key Tools Every Trader Should Know
You don’t need to be a math genius to use technical analysis. Most traders rely on a handful of visual tools and indicators.
1. Price Charts
These are the foundation. Three main types:
- Line chart – Simple, shows closing prices.
- Bar chart – Adds open, high, and low.
- Candlestick chart – The favorite. It shows open, high, low, close, and offers clear signals of market sentiment.
Candlestick patterns like “doji,” “hammer,” or “engulfing” can hint at reversals or momentum.
2. Moving Averages
A moving average smooths out price data to reveal the underlying trend.
- Simple Moving Average (SMA) – Straight average over a period
- Exponential Moving Average (EMA) – Weighs recent prices more heavily
A common signal: when the 50-day MA crosses above the 200-day MA, it’s called a golden cross — often seen as bullish.
3. MACD and RSI
- MACD (Moving Average Convergence Divergence) helps spot trend changes and momentum shifts.
- RSI (Relative Strength Index) tells you if something is overbought (above 70) or oversold (below 30).
These tools are great for timing trades — especially in volatile markets like crypto.
4. Chart Patterns
Patterns repeat. That’s a big idea in technical analysis.
Some common ones:
- Head and Shoulders – Often signals a trend reversal
- Double Top / Bottom – Signals a market turning point
- Triangles and Flags – Show consolidation before a big move
Recognizing these patterns helps you anticipate — rather than react to — price moves.
5. Support and Resistance Levels
Support = where prices tend to stop falling
Resistance = where prices tend to stop rising
These levels help traders set entry points and stop losses — and avoid buying the top or selling the bottom.
Popular Trading Strategies Using Technical Analysis
Depending on your goals, here are a few ways traders use technical analysis:
- Trend Following – Ride the wave in the direction of the trend.
- Mean Reversion – Bet that prices will snap back after a sharp move.
- Momentum Trading – Jump in when prices accelerate.
- Breakout Trading – Buy when price breaks past resistance or sell when it falls below support.
- Swing Trading – Hold trades for days or weeks, using patterns and indicators for timing.
Where Technical Analysis Works Best
This method isn’t just for Wall Street pros. It’s used in:
- Stock markets – To fine-tune entry/exit points
- Crypto – Where fundamentals are unclear or non-existent
- Forex – High liquidity and short-term price moves make it ideal
- Commodities – Where price behavior often follows patterns.
The Pros and Cons
Benefits
- Works across markets and timeframes
- Helps with risk management
- Great for short-term decision-making
- Offers insights into market psychology
Drawbacks
- Can give false signals, especially in choppy markets
- Often lagging — you see the signal after the move starts
- Doesn’t account for news or earnings
- Can be subjective — two people may read the same chart differently.
Is Technical Analysis Right for You?
If you like visual thinking, pattern recognition, and data-driven decision-making, technical analysis can be a powerful tool. But it’s not magic. It works best when:
- Combined with solid risk management
- Used alongside fundamental analysis
- Applied consistently with clear rules
Whether you’re trading stocks, crypto, or currencies, understanding the basics of technical analysis can give you an edge.
Key Takeaways
- Technical analysis helps traders forecast market moves by studying price charts and volume.
- Tools like moving averages, RSI, and candlestick patterns are central to this approach.
- It’s especially useful for short-term trading and market timing.
- While powerful, it’s not foolproof — combining it with other methods improves success.
FAQs
Q: Can beginners use technical analysis?
A. Yes! Many tools are visual and easy to learn. Start with charts and basic indicators like moving averages and RSI.
Q: Does technical analysis work in crypto?
A. Absolutely. In fact, many crypto traders rely heavily on it since there’s limited fundamental data.
Q: What’s the best chart type for beginners?
A. Candlestick charts. They offer the most insight into price behavior at a glance.
Q: Is technical analysis better than fundamental analysis?
A. Not better — just different. Many successful traders use both together.
Disclaimer
The stocks mentioned in this article are not recommendations. Please conduct your own research and due diligence before investing. Investment in securities market are subject to market risks, read all the related documents carefully before investing. Please read the Risk Disclosure documents carefully before investing in Equity Shares, Derivatives, Mutual fund, and/or other instruments traded on the Stock Exchanges. As investments are subject to market risks and price fluctuation risk, there is no assurance or guarantee that the investment objectives shall be achieved. Lemonn (Formerly known as NU Investors Technologies Pvt. Ltd) do not guarantee any assured returns on any investments. Past performance of securities/instruments is not indicative of their future performance.
Related Posts
Download Lemonn
Download my app for share market trading, ipo investment, trading account, and all your investment needs.


