
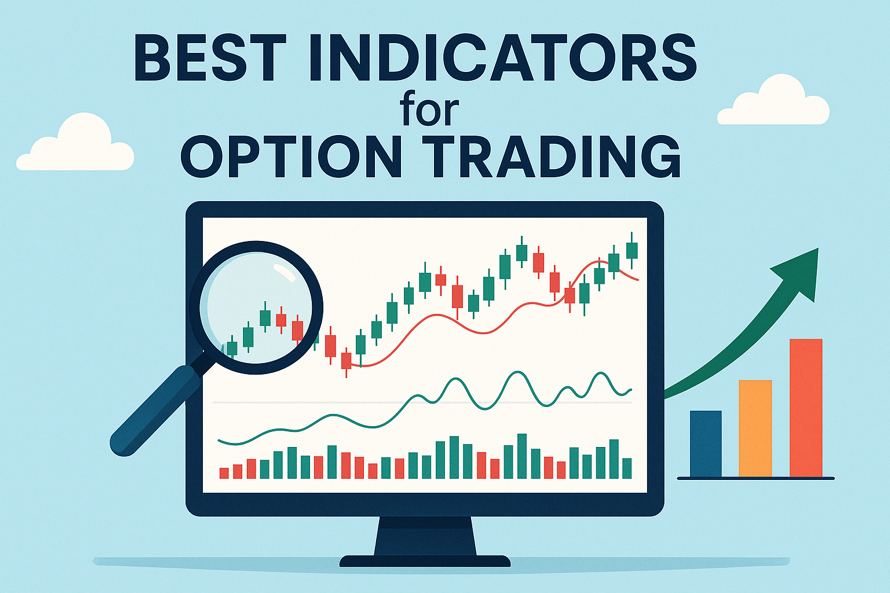
Best Indicators for Options Trading (2026 Guide)
Introduction
Why Indicators Matter in Options Trading
Options trading is fast-paced and highly sensitive to price, volatility, and time decay.
Technical indicators help traders:
- Identify trends
- Time entries and exits
- Manage risk effectively
Without indicators, trading decisions often become guesswork.
“Start investing with confidence! Explore
option trading
and grow your wealth.”
How to Choose the Right Indicators for Your Trading Style
The right indicators depend on your strategy:
- Intraday traders: RSI, VWAP, OI
- Swing traders: Moving averages, MACD
- Options sellers: Implied volatility, Theta
Avoid using too many indicators at once. Focus on 2 to 3 that complement each other.
Top Technical Indicators for Options Trading
Relative Strength Index (RSI)
- Measures momentum (0 to 100)
- Above 70: Overbought
- Below 30: Oversold
Use case: Identify reversal points in options buying.
Moving Averages (MA)
Exponential Moving Average (EMA)
- Gives more weight to recent prices
- Faster signals
Simple Moving Average (SMA)
- Smooths price trends
- Slower but reliable
Use case: Identify trend direction for call or put buying.
Bollinger Bands
- Measures volatility using upper and lower bands
- Price near upper band: Overbought
- Price near lower band: Oversold
Use case: Ideal for range-bound strategies.
Implied Volatility (IV) and IV Rank
- Shows expected future volatility
- High IV: Expensive options
- Low IV: Cheap options
Use case:
- Sell options when IV is high
- Buy options when IV is low
Open Interest (OI) Analysis
- Indicates number of open contracts
Key insights:
- Rising price + rising OI = Strong trend
- Falling price + rising OI = Short buildup
Average True Range (ATR)
- Measures volatility
- Higher ATR = larger price movement
Use case: Set stop-loss levels.
MACD (Moving Average Convergence Divergence)
- Tracks trend and momentum
- Signal line crossover indicates entry
Use case: Confirm trend continuation or reversal.
Option Greeks (Delta, Gamma, Theta, Vega)
| Greek | Meaning |
|---|---|
| Delta | Price movement sensitivity |
| Gamma | Delta change rate |
| Theta | Time decay |
| Vega | Sensitivity to volatility |
Use case: Essential for advanced options strategies.
How to Use Indicators in Option Trading
Combining Indicators for Better Accuracy
Use a combination like:
- RSI + EMA (trend + momentum)
- IV + OI (volatility + positioning)
Identifying Entry and Exit Points
- Enter when indicators align (trend + momentum)
- Exit based on target or reversal signal
Risk Management Strategies with Indicators
- Use ATR for stop-loss
- Avoid trades during low volatility
- Monitor IV before entering trades
Options Trading Strategies Using Indicators
Trend Following Strategies
- Use EMA + MACD
- Trade in direction of trend
Volatility-Based Strategies
- Use IV and Bollinger Bands
- Sell options in high IV markets
Range-Bound Strategies
- Use RSI + Bollinger Bands
- Ideal for sideways markets
Common Mistakes in Using Indicators for Options
Over-Reliance on a Single Indicator
No indicator is 100% accurate. Always combine tools.
Ignoring Market Conditions and News Events
Indicators may fail during:
- Budget announcements
- RBI policy
- Global events
Misinterpreting Implied Volatility
High IV does not always mean price will move more. It reflects expectations.
Conclusion
In 2026, successful options trading requires a mix of technical indicators and market understanding.
Indicators like RSI, IV, OI, and moving averages can improve decision-making, but they work best when combined with proper risk management and discipline.
FAQs
Q. Which indicator is best for options trading beginners?
RSI and Moving Averages are simple and effective for beginners.
Q. How can I use RSI for options trading?
Use RSI to identify overbought and oversold conditions for entry and exit.
Q. What is the role of Implied Volatility in options?
It helps determine option pricing and strategy selection.
Q. How does Open Interest affect options trading decisions?
It shows market participation and helps confirm trends.
Q. Are Bollinger Bands useful for options traders?
Yes, especially for identifying volatility and range-bound markets.
Q. Can I rely on a single indicator for option trading?
No, combining indicators improves accuracy.
Q. How do Option Greeks help in trading decisions?
They measure risk factors like time decay and volatility impact.
Q. What are some free tools for indicator analysis in options?
– TradingView
– NSE option chain
– Broker platforms
Disclaimer
The stocks mentioned in this article are not recommendations. Please conduct your own research and due diligence before investing. Investment in securities market are subject to market risks, read all the related documents carefully before investing. Please read the Risk Disclosure documents carefully before investing in Equity Shares, Derivatives, Mutual fund, and/or other instruments traded on the Stock Exchanges. As investments are subject to market risks and price fluctuation risk, there is no assurance or guarantee that the investment objectives shall be achieved. Lemonn (Formerly known as NU Investors Technologies Pvt. Ltd) do not guarantee any assured returns on any investments. Past performance of securities/instruments is not indicative of their future performance.
Related Posts

Download Lemonn
Download my app for option trading, IPO, 0 demat account, stocks, and dive into the stock market.


