
What are double top and bottom patterns, and how to use them

Why do markets move? Investors and analysts often attribute it to news. However, some market watchers try to make and interpret charts to make sense of it all. Technical analysis is an equity trader’s best friend. Technical analysts use historical market data of a security or an index to predict future price movements. Studying charts is an essential part of technical analysis and is used by traders to identify patterns and trends in price and trading volume. With some training, chartists or technical analysts can easily identify trends and patterns such as head and shoulders, double top pattern, lines of support, and resistance, etc.
In this blog post, we will discuss the double top and double bottom patterns. Read on to learn more about how to identify the double top and bottom pattern, its uses and applications in real market scenario.
What is a double top and bottom?
Understanding chart patterns is essential to forecast future price changes. Two of the most important patterns that traders use to spot possible trend reversals are the double top and double bottom.
When two peaks at almost the same price level are separated by a trough, a double top creates an M pattern, which denotes a bearish reversal pattern that follows an uptrend. It suggests that there may be further drops ahead because the price has twice approached a resistance level but has not broken through.
A double bottom, on the other hand, creates a W pattern, which is a bullish reversal pattern that follows a downward trend and is characterized by two troughs at comparable levels with a high in between.
Both patterns are crucial for traders to identify potential trend reversals in financial markets.
Understanding double tops and bottoms
Double top and double bottom patterns are reversal patterns that signal potential shifts in market direction.
“Start investing with confidence! Explore
share market
and grow your wealth.”
Double top pattern
This pattern resembles the letter “M” and typically indicates a bearish reversal after an uptrend. It forms when the price reaches a peak, retraces, and then rises again to test the same resistance level, but fails to break through.
Formation of double top pattern
The M pattern or the double top pattern is formed if the price of the security follows the pattern specified below:
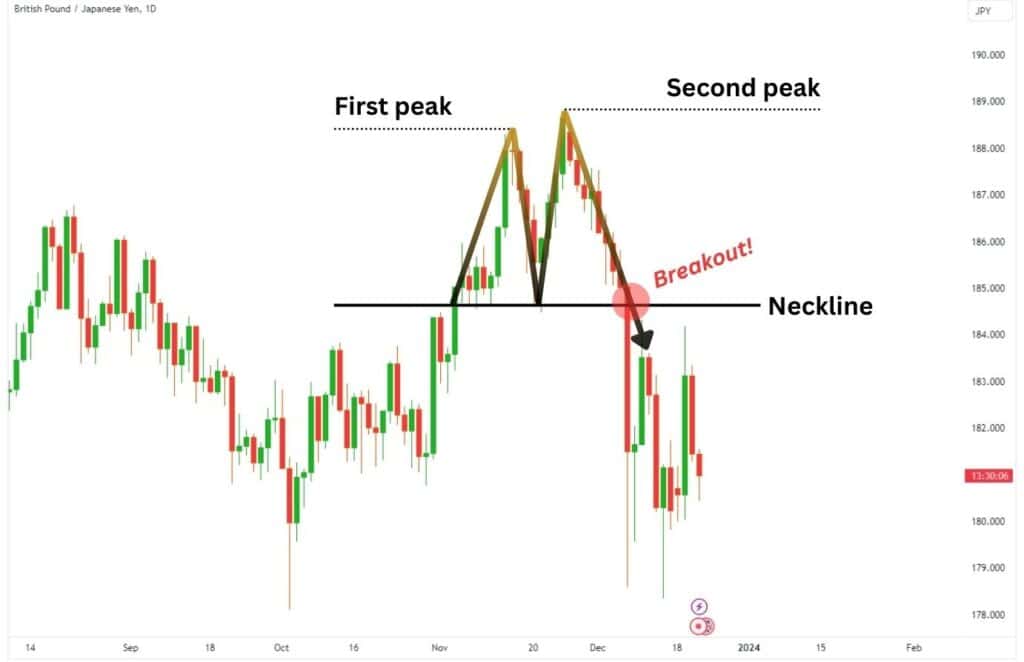
- First Peak: The price rises to a high (first peak) after an extended bullish trend.
- Retracement: The price then retraces back to a support level known as the neckline.
- Second Peak: The price attempts to rise again but fails to surpass the first peak, forming the second peak.
- Confirmation: The pattern is confirmed when the price breaks below the neckline following the second peak.
How to identify double top pattern on a chart
Double bottom pattern
A double bottom pattern is a bullish reversal pattern that appears after a downtrend. It consists of two troughs at similar levels, with a peak in between. This pattern indicates that the asset has found support and may rise significantly after the second low.
Formation of double bottom pattern
Double bottom, which is essentially the opposite of double top, is formed when the price of a security follows the pattern shown below.
- First Low: The price declines to a low (first trough) after a prolonged bearish trend.
- Retracement: The price retraces back to a resistance level (neckline).
- Second Low: The price dips again but does not fall below the first low, creating the second trough.
- Confirmation: The pattern is confirmed when the price breaks above the neckline after forming the second low.
Key characteristics of double top and double bottom pattern
- Volume Analysis
Volume plays an essential role in confirming these patterns. For double tops, increased volume at the breakdown below the neckline indicates strong selling pressure. For double bottoms, higher volume during the breakout above the neckline suggests robust buying interest.
- Height measurement
Traders often use the height of the pattern (the distance from peak to neckline for double tops or trough to neckline for double bottoms) to set profit targets once the breakout occurs.
Trading strategies using double tops and bottoms
As a trader, you can make use of double top and double bottom patterns for identifying the following.
Trading Double Tops
- Identify Entry Point: Once a double top is confirmed with a break below the neckline, traders can enter short positions just below this level.
- Setting Stop-Loss Orders: A stop-loss order should be placed above the second peak to minimize potential losses in case of a false breakout.
- Profit Target Calculation: Measure the height of the double top pattern and project that distance downward from the neckline to set profit targets.
- Monitoring Volume: Ensure that volume increases during breakdowns as this reinforces the validity of the pattern.
Trading Double Bottoms
- Identify Entry Point: After confirming a double bottom with a breakout above the neckline, traders can initiate long positions at this level.
- Setting Stop-Loss Orders: A stop-loss order should be set just below the second trough to protect against adverse movements.
- Profit Target Calculation: Similar to double tops, measure the height from trough to neckline and project that distance upward from the neckline for profit targets.
- Volume Confirmation: Watch out for increased volume on breakouts as it indicates strong buying momentum.
Limitations of double tops and bottoms
While double tops and bottoms are powerful tools in technical analysis, they are not foolproof:
- False signals: Sometimes, prices may create peaks or troughs without completing a full pattern, leading traders to make premature decisions based on incomplete information.
- Market conditions: External factors such as economic news or geopolitical events can heavily influence market behavior, rendering technical patterns less reliable.
- Confirmation is key: Relying solely on visual identification without waiting for confirmation through volume or additional indicators can lead to incorrect trades.
Conclusion
Double top and bottom patterns are vital components of technical analysis that provide traders with insights into potential market reversals. By understanding how these patterns form and implementing effective trading strategies based on them, traders can enhance their decision-making processes in various market conditions.
Traders can successfully trade using these patterns by following the steps outlined below:
- Always wait for confirmation through volume changes.
- Set appropriate stop-loss orders to manage risk effectively.
- Use height measurements for setting realistic profit targets.
By incorporating double tops and bottoms into your trading strategy, you can navigate market fluctuations better and capitalize on potential reversals effectively. Understanding these patterns helps in making informed trading decisions and contributes to develop a comprehensive approach to market analysis.
Disclaimer
The stocks mentioned in this article are not recommendations. Please conduct your own research and due diligence before investing. Investment in securities market are subject to market risks, read all the related documents carefully before investing. Please read the Risk Disclosure documents carefully before investing in Equity Shares, Derivatives, Mutual fund, and/or other instruments traded on the Stock Exchanges. As investments are subject to market risks and price fluctuation risk, there is no assurance or guarantee that the investment objectives shall be achieved. Lemonn (Formerly known as NU Investors Technologies Pvt. Ltd) do not guarantee any assured returns on any investments. Past performance of securities/instruments is not indicative of their future performance.
Related Posts


Download Lemonn
Download my trading app for SIP, demat account services—get a free demat account with our demat apps.


