Hyundai Motor IPO Highlights
Executive Summary:
Hyundai Motor India, a subsidiary of the South Korean automotive giant Hyundai Motor Company, is poised to launch Initial Public Offerings (IPOs) with an issue size of Rs 27,870.16 crores next week. This strategic move comes at a pivotal moment for the global automotive industry, characterized by a rapid shift towards electrification, evolving consumer preferences, and complex geopolitical dynamics.
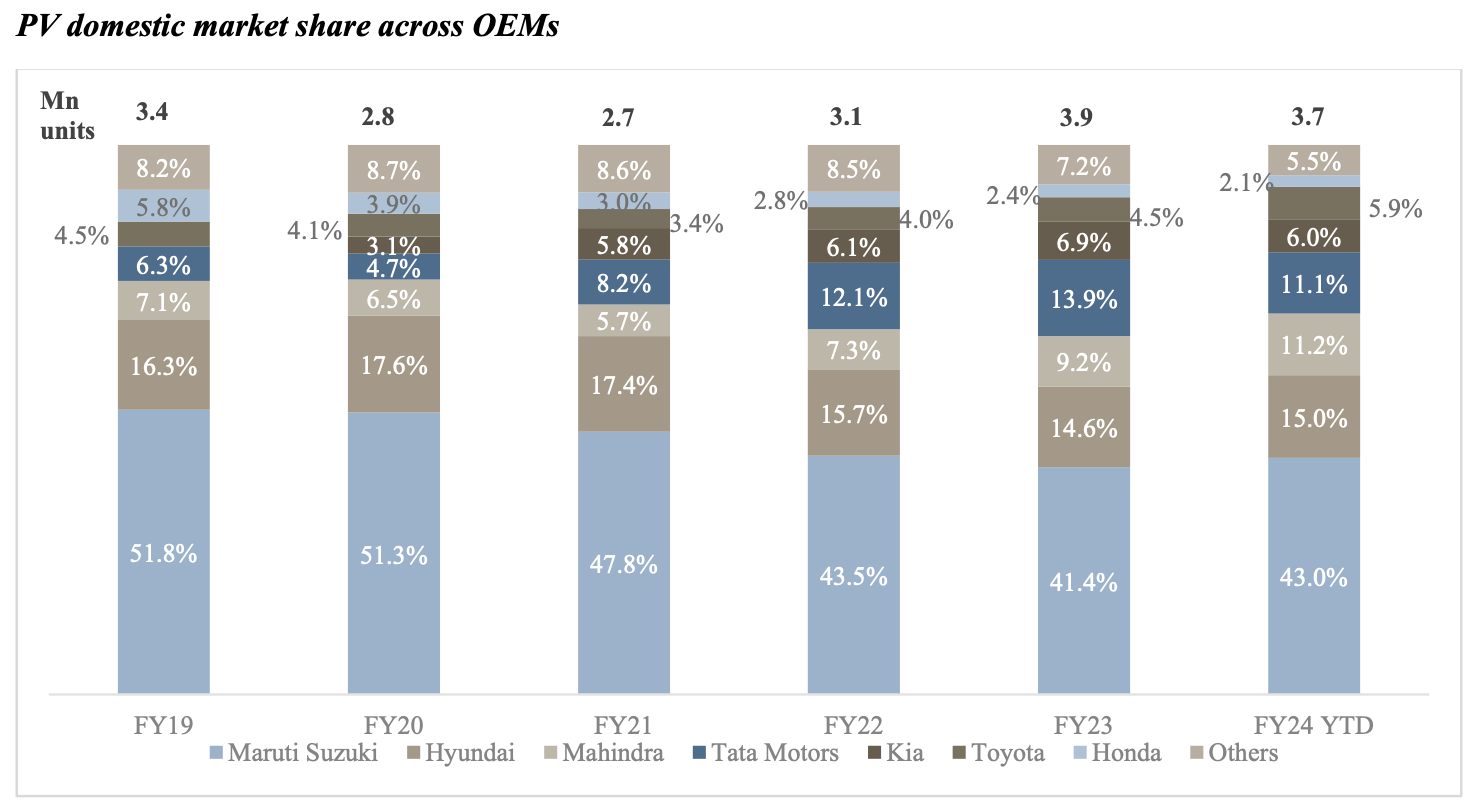
Hyundai has been a significant player in the Indian automotive market since its entry in 1996. Over the past two decades, the company has consistently ranked as the second-largest car manufacturer in India, with a market share of approximately 15% as of 2023. Hyundai’s success in India has been driven by its ability to offer a diverse range of vehicles tailored to local preferences, coupled with a strong focus on quality and after-sales service.
In this note, we take a quick look at the key highlights of the offering along with a brief overview of the 4-wheeler industry outlook and deep dive into the company’s financials in comparison to its listed peers.
Before we dive deeper, let’s look at the key strengths and risk factors to be considered before one decides on investing in this IPO.
IPO Details
| IPO Date | October 15, 2024 to October 17, 2024 |
| Price Band | ₹1865 to ₹1960 per share |
| Total Issue Size | ₹27,870.16 Cr |
| Offer for Sale | ₹27,870.16 Cr |
Key Strengths:
- Established player in India, understands the Indian market and has been consistent ranked as the second-largest car manufacturer in India
- Commitment to R&D Innovation: Hyundai’s investment in research and development has placed the company at the forefront of automotive technology, particularly in the areas of hydrogen fuel cells and electric vehicles (EVs). Their emphasis on alternative fuel sources, such as hydrogen, distinguishes them as one of the few major automakers aggressively pursuing this technology.
- Global Manufacturing Footprint: Hyundai operates an extensive global production network, with manufacturing plants in key regions such as the United States, South Korea, China, and India. This diverse footprint allows Hyundai to scale operations efficiently, optimize costs, and reduce dependency on any single market.
- Vertical Integration of Supply Chain: Through its ownership of key subsidiaries like Hyundai Steel and Hyundai Mobis, the company maintains a high degree of control over its supply chain. This vertical integration enables Hyundai to streamline production processes, manage costs effectively, and respond flexibly to market demands.
- Expansion into Electric Vehicles: Hyundai has made significant strides in the EV sector, committing substantial resources to the development of a robust electric vehicle portfolio. Models such as the Ioniq 5 have already received critical acclaim, positioning the company as a key player in the rapidly growing EV market.
- Strategic Collaborations: Hyundai has formed numerous strategic partnerships to bolster its technological capabilities. Notable collaborations include ventures with Aptiv on autonomous driving technology and previous discussions with Apple regarding self-driving cars. These partnerships position Hyundai as a forward-thinking entity in an evolving industry landscape.
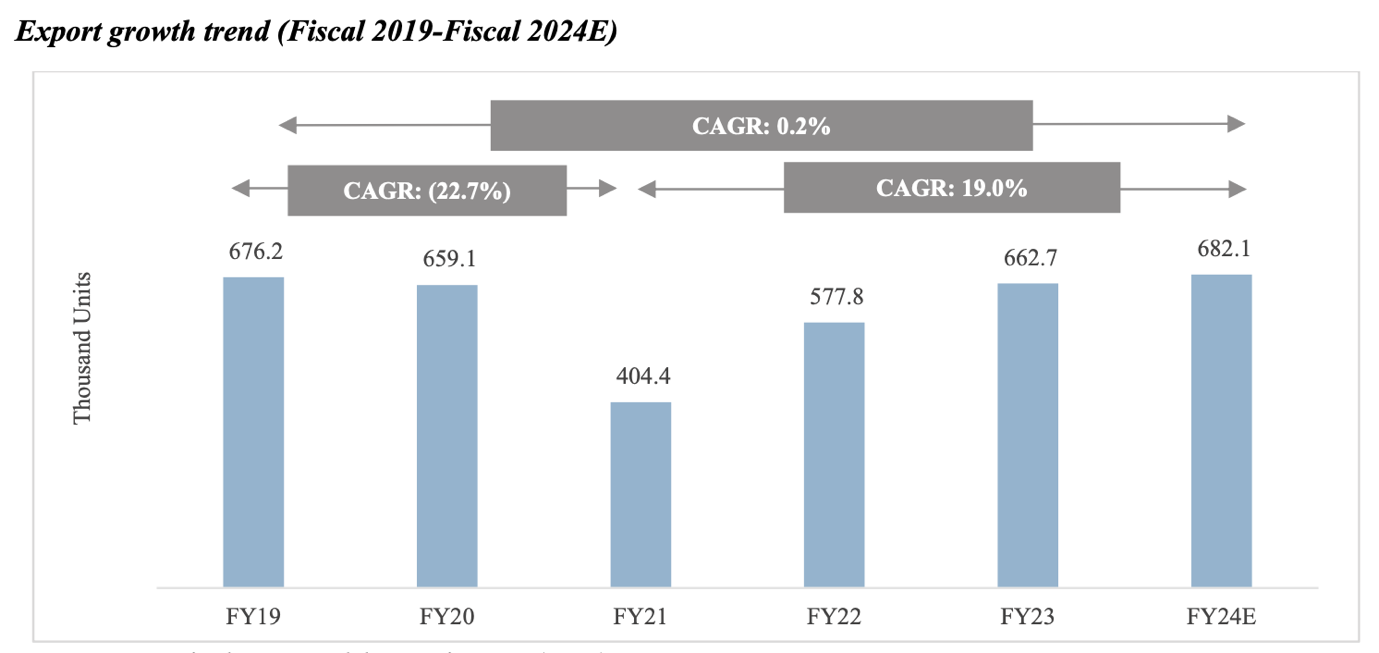
Market Leader in Exports
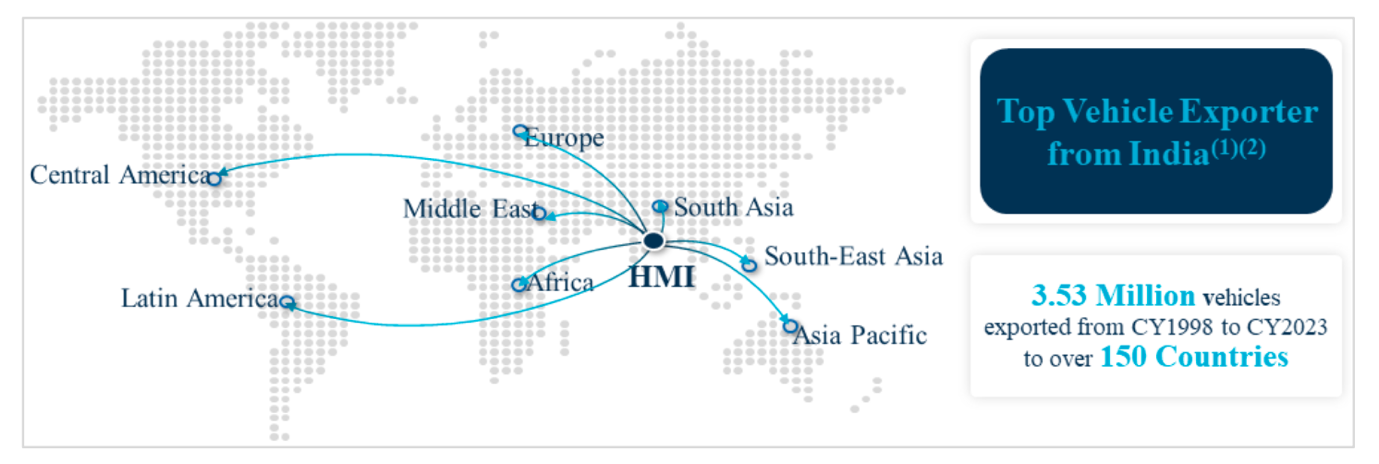
- Market Leadership in Exports: Hyundai Motor India has consistently been the largest exporter of passenger vehicles from India, maintaining this position from Fiscal 2005 up to the first 11 months of Fiscal 2024. Over this period, Hyundai has exported 3.53 million passenger vehicles to more than 150 countries, with a focus on regions such as Latin America, Africa, the Middle East, and Asia.
- Export Volume Growth: In Fiscal 2023, Hyundai exported 153,000 units, reflecting a growth of 18.4% compared to 129,300 units in Fiscal 2022. This rise was driven largely by increased demand from African and Latin American markets, particularly for models like Verna, Grand i10, and Aura. The export volume for Fiscal 2024 YTD stands at 150.6 thousand units, showing continued momentum.
- SUVs and Sedans Leading Export Models: Hyundai’s top export models include the Verna, which has maintained a strong presence in the export market, especially with the launch of the 6th generation Verna. Additionally, SUVs such as the Creta, Alcazar, and Venue are among the leading models exported, alongside compact sedans like Aura and Xcent, reinforcing Hyundai’s robust presence across various vehicle segments
- Top Export Destinations: The main export destinations for Hyundai are South Africa, Saudi Arabia, Chile, and Mexico, highlighting the company’s strong foothold in emerging and developing markets
- Export Growth Outlook: The company’s exports are expected to continue growing at a CAGR of 7-9% between Fiscal 2024 and Fiscal 2029. This growth will be fueled by anticipated economic stability, an increased push from OEMs, and India’s trade agreements. Hyundai aims to expand its production capacity in India, leveraging it as a hub for exporting vehicles to regions like Africa, the Middle East, and Asia.
Key Risks:
- Intensifying competition in the EV market, where some companies are mainly focusing on EV segment but positioning of Hyundai is not clear.
- Potential market saturation in mature markets, putting pressure on profit margins.
- Supply chain disruptions and semiconductor shortages, which have led to production delays.
- Geopolitical pressures impacting global operations, especially in key markets like China and the United States.
- There are concerns about potential brand conflicts with Kia.
Valuation:
At the upper band company is valuing at 26.2x its FY24 earnings along with being valued at 26.7x if we annualize FY25 earnings. Following the issuance of equity shares, the company’s market capitalization stands at ₹15,92,581 million, with a market cap-to-sales ratio of 2.28 based on its FY24 earnings.
Industry Overview & Outlook:
The Indian four-wheeler passenger vehicle (PV) industry is witnessing substantial changes, driven by evolving consumer preferences, technological advancements, and economic growth. Here’s a comprehensive overview based on recent insights:
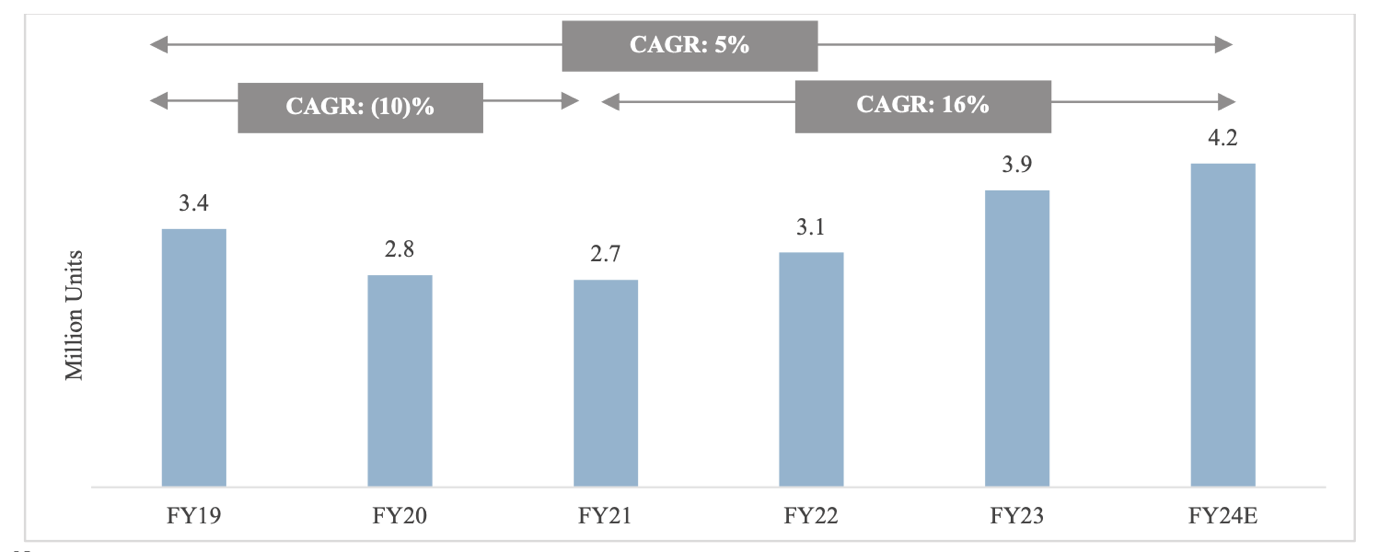
Market Dynamics:
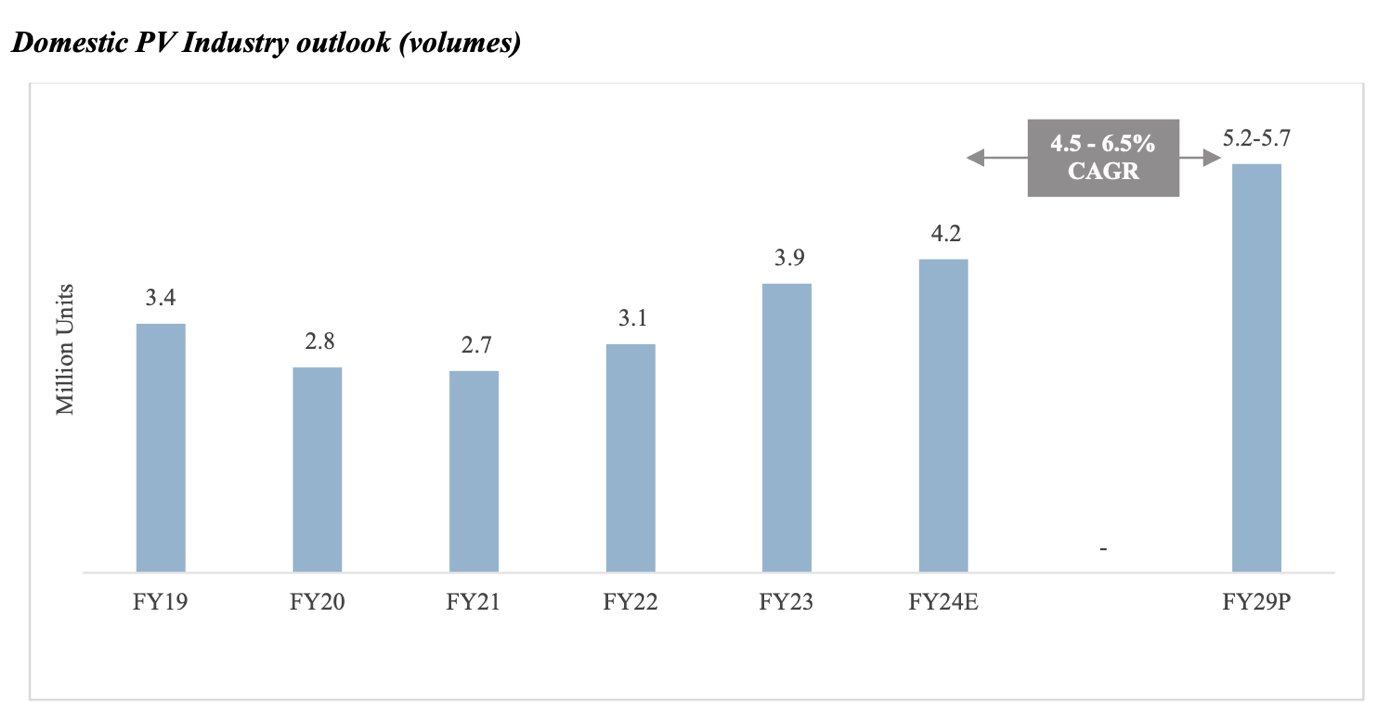
India’s domestic PV market has grown at a CAGR of 5% between FY2019 and FY2024, with the total sales volume reaching a historic high of 4.2 million units in FY2024. A significant factor contributing to this growth has been the post-pandemic recovery, characterized by a surge in demand for personal mobility. The industry was previously affected by the economic contraction and challenges such as the NBFC liquidity crisis and the transition to BS-VI norms.
Key Segments:
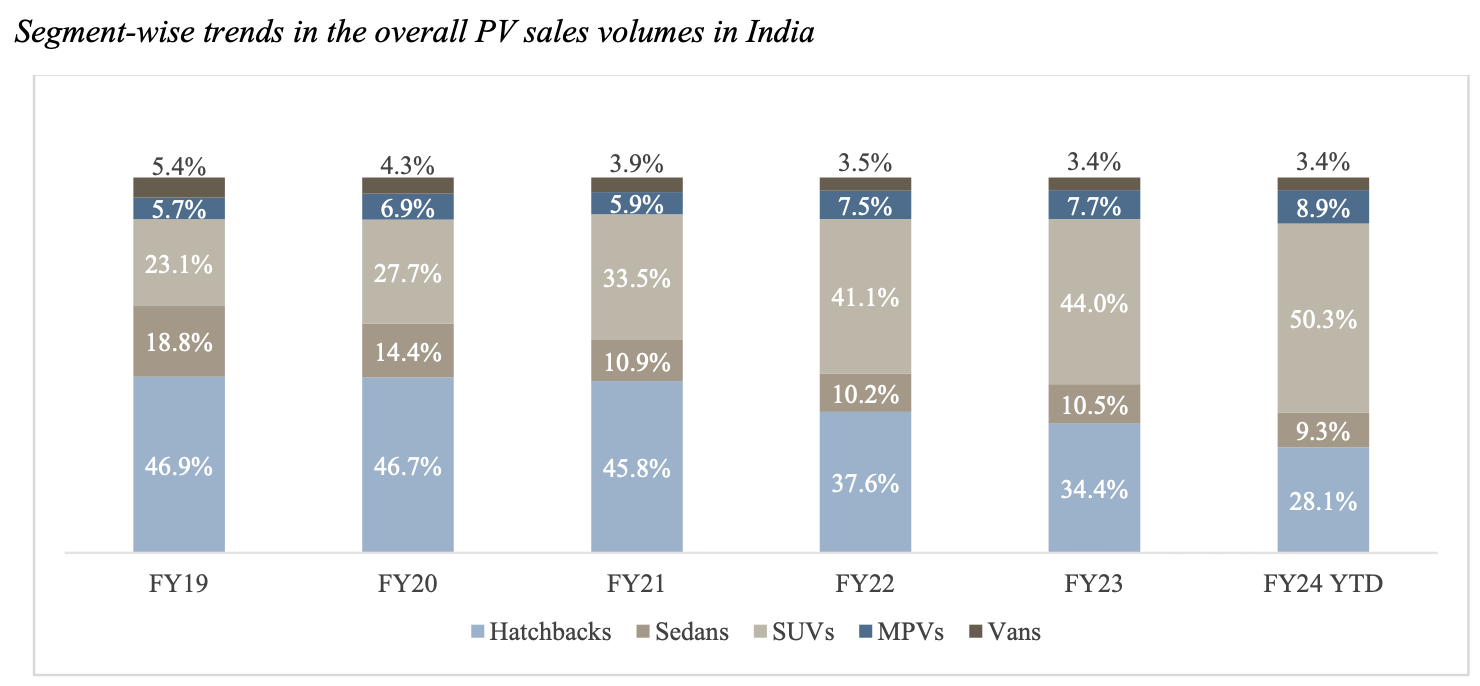
SUVs, particularly compact and mid-size variants, dominate the Indian market. Over the last five years, a clear shift in consumer preference has emerged, moving from hatchbacks toward feature rich SUVs. This trend is reflected in the market share changes, where SUVs now account for over 50% of the PV market, a dramatic increase from just 23% in FY2019. In contrast, hatchbacks and sedans are experiencing slower growth or even decline.
Powertrain Transformation:
While conventional petrol and diesel vehicles still dominate, the adoption of alternative powertrains such as CNG and electric vehicles (EVs) is gaining momentum. CNG variants now hold a 15% market share, and the EV segment, though nascent, is growing, projected to reach a 17-20% share by FY2029. The strong hybrid vehicles market is also expanding, buoyed by government incentives and rising consumer interest
Economic and Policy Factors:
India’s per capita income is expected to grow at a CAGR of 8.8% from FY2023 to FY2028, providing more disposable income for consumers, which in turn increases the demand for automobiles. Car penetration, currently at 26 cars per 1,000 people, is still relatively low compared to developed and emerging nations, highlighting substantial growth potential.
Competitive Landscape:
The Indian PV market is oligopolistic, with four key players—Maruti Suzuki, Hyundai Motor India, Tata Motors, and Mahindra & Mahindra—controlling approximately 80% of the market. New entrants such as Kia and MG have intensified competition by offering competitively priced, feature-rich vehicle.
Premiumization Trend:
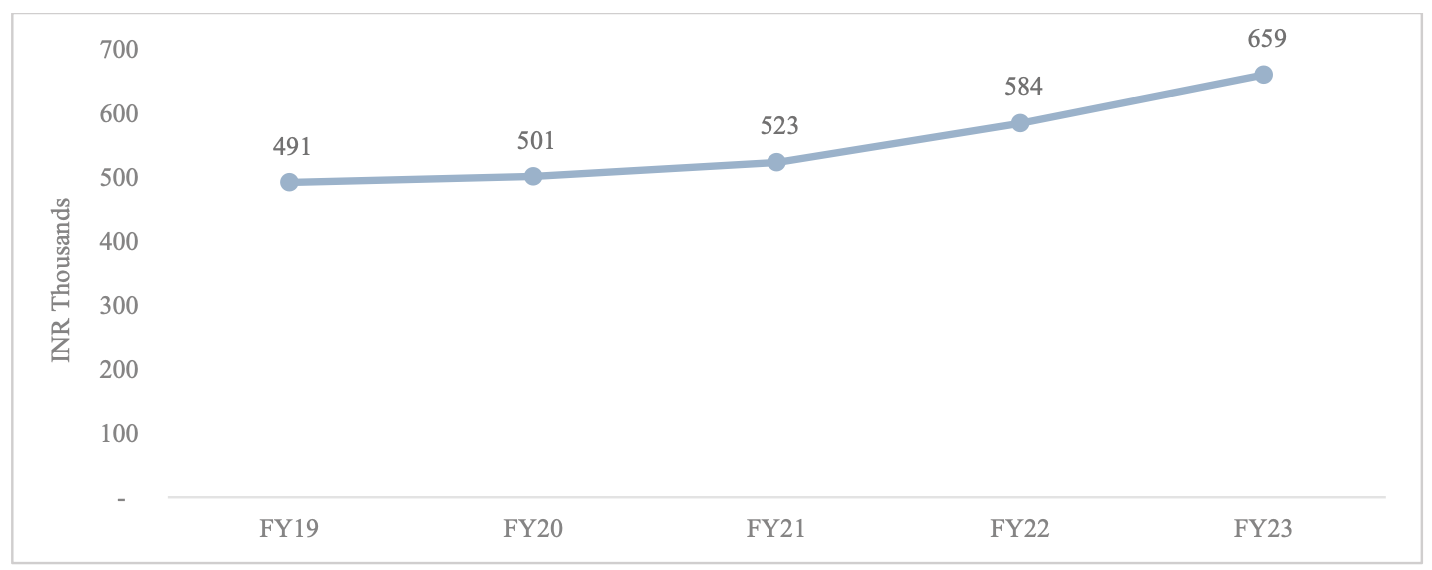
There is a clear trend toward premiumization, with consumers opting for higher-end models equipped with advanced features such as sunroofs, digital infotainment systems, and ADAS (Advanced Driver Assistance Systems). This shift is further driving up the average selling price (ASP) of vehicles, which has been growing at a CAGR of 7-8% from FY2019 to FY2023.
Outlook:
The Indian PV market is expected to continue its growth trajectory, with a projected CAGR of 4.5 6.5% between FY2024 and FY2029. The market size is anticipated to reach 5.7 million units by FY2029, driven by increasing demand for SUVs, continued expansion of EV and CNG infrastructure, and rising consumer income levels.
While the market is growing, it is also evolving rapidly, with shifting consumer preferences, increasing competition, and a move toward alternative powertrains shaping its future trajectory.
Key Financials
| Year | Revenue from Operations (₹ million) | Profit Before Tax (₹ million) | Profit After Tax (₹ million) | Operating Expenses (₹ million) |
| FY2023 | 603,075.80 | 63,455.75 | 47,092.50 | 550,910.67 |
| FY2022 | 473,784.32 | 37,722.06 | 29,015.91 | 441,938.42 |
| FY2021 | 409,722.51 | 25,402.48 | 18,811.56 | 388,644.02 |
Peer Comparison
| Name of the Company | Revenue from operations for Financial Year 2023 (in ₹ million) | Price/ earnings ratio for the Financial Year 2023(3) | Return On Net Worth for the Financial Year 2023 (%) |
| Hyundai | 603,075.80 | ~26.7 | 23.48% |
| Maruti Suzuki | 1,175,713 | 47.28 | 13.29% |
| Tata Motors | 3,459,669.70 | 150.09 | 5.33% |
| Mahindra & Mahindra | 1,212,685.50 | 30.32 | 18.24% |
Insights:
- Market Leadership: Hyundai’s profitability and operational margins are robust, positioning it as a strong competitor to Maruti Suzuki. Though Maruti dominates with a larger market share, Hyundai’s focus on SUVs and premiumization has kept it competitive.
- Competitive Margins: Hyundai’s RoNW and operating margins outperform Tata Motors and Mahindra & Mahindra, signifying better utilization of capital and operational efficiency.
- Strategic Expansion: Hyundai’s investments in electric vehicles (EVs) and alternative fuel technology signal its intent to maintain its strong position as consumer preferences shift toward sustainable mobility solutions.
Disclaimer
The stocks mentioned in this article are not recommendations. Please conduct your own research and due diligence before investing. Investment in securities market are subject to market risks, read all the related documents carefully before investing. Please read the Risk Disclosure documents carefully before investing in Equity Shares, Derivatives, Mutual fund, and/or other instruments traded on the Stock Exchanges. As investments are subject to market risks and price fluctuation risk, there is no assurance or guarantee that the investment objectives shall be achieved. Lemonn (Formerly known as NU Investors Technologies Pvt. Ltd) do not guarantee any assured returns on any investments. Past performance of securities/instruments is not indicative of their future performance.