
Bollinger Bands: Squeeze, Breakout, and Mean Reversion
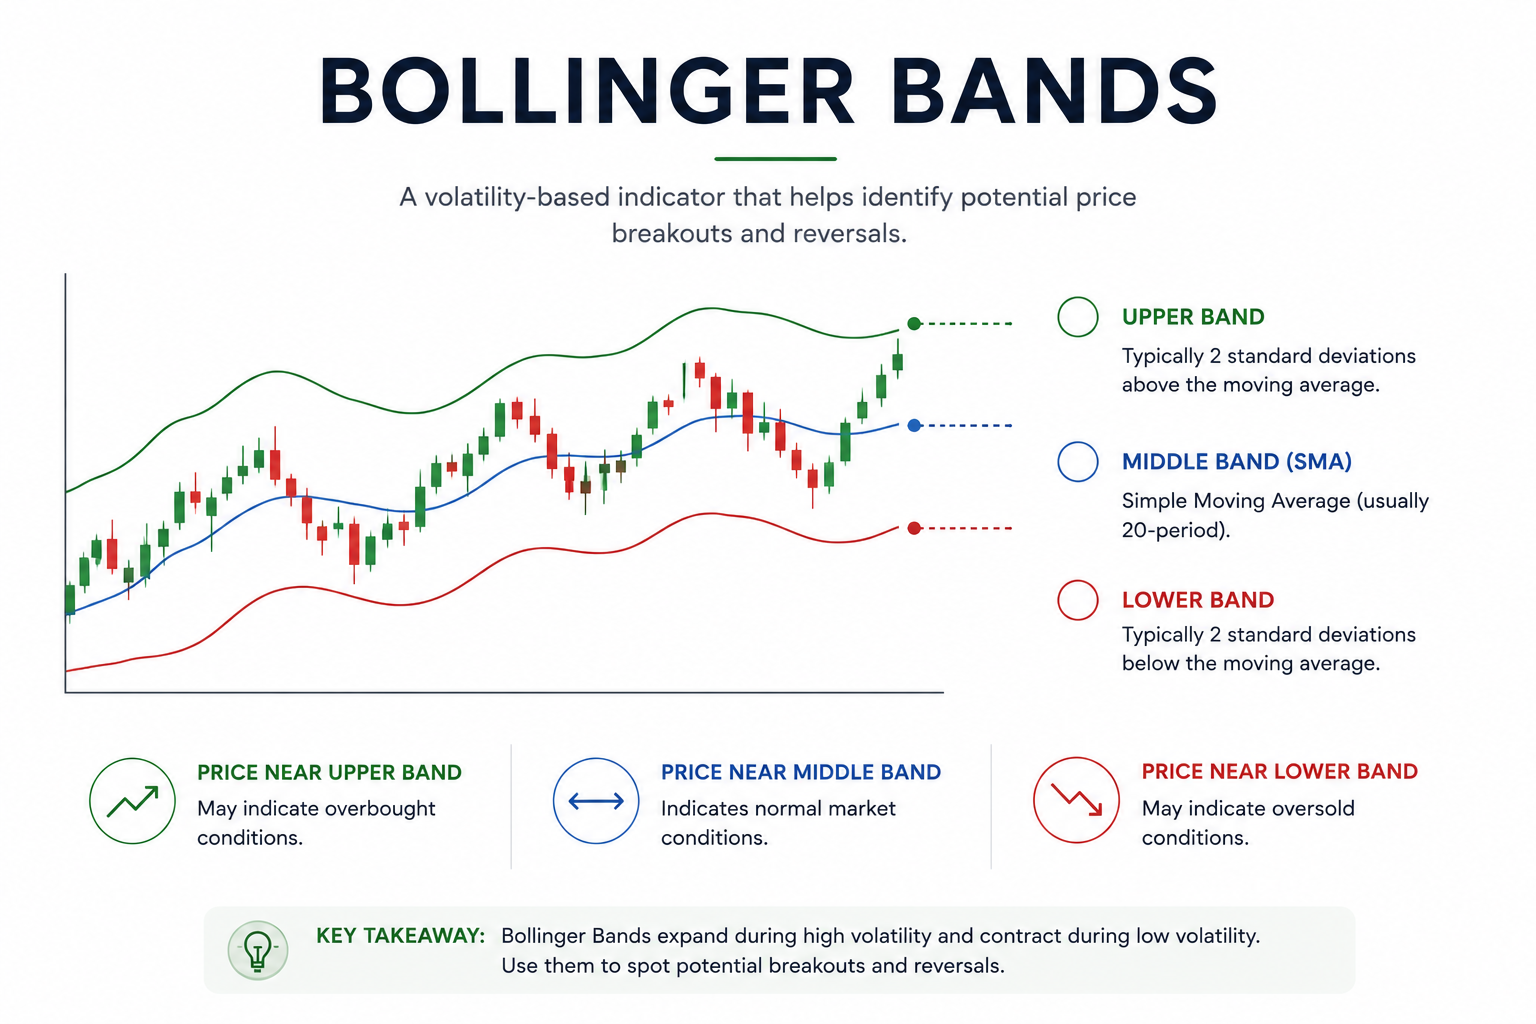
Bollinger Bands are a volatility-based technical indicator used to identify periods of contraction, expansion, and unusually stretched prices. Traders commonly use them for three setups: a Bollinger Band squeeze before a potential large move, breakout trades when price moves beyond the bands, and mean-reversion trades when price moves too far from its recent average.
The key is not to treat every touch of the upper band as a sell signal or every touch of the lower band as a buy signal. Bollinger Bands work best when you first identify whether the market is trending, consolidating, or temporarily stretched.
What Are Bollinger Bands?
Bollinger Bands consist of three lines plotted around price:
- Middle band: Usually a 20-period simple moving average
- Upper band: Middle band plus a specified number of standard deviations
- Lower band: Middle band minus the same number of standard deviations
The classic setting is:
20-period moving average with bands 2 standard deviations away
In simplified form:
Upper Band = 20-period SMA + 2 standard deviations
Lower Band = 20-period SMA – 2 standard deviations
Standard deviation measures how widely prices are moving around their average.
When volatility rises, the bands generally widen.
When volatility falls, they generally contract.
That changing width is what makes Bollinger Bands useful for analyzing volatility.
What Do Bollinger Bands Tell You?
Bollinger Bands can help answer three practical questions:
- Is volatility unusually low?
- Is price beginning a strong directional move?
- Has price moved unusually far from its recent average?
Those questions correspond to the three main trading approaches covered here:
- Bollinger Band squeeze
- Bollinger Band breakout
- Bollinger Band mean reversion
The same indicator can therefore be used in very different ways depending on market structure.
“Start investing with confidence! Explore
share market
and grow your wealth.”
How to Read Bollinger Bands
The first thing to watch is the relationship between price and the bands.
Narrow Bands
As the bands move closer together, volatility contracts.
This often occurs during consolidation.
A period of low volatility can eventually be followed by a larger move, although the bands do not tell you in advance which direction the breakout will take.
Wide Bands
When the bands spread farther apart, volatility has increased.
This often happens after:
- A breakout
- Major news
- Strong momentum
- A sharp price move
Widening bands are not automatically a reason to exit a trade. During a strong trend, they can remain wide for an extended period.
Price Near the Upper Band
Price near or above the upper band can indicate strong upside momentum.
It does not automatically mean the asset is overbought or ready to fall.
Price Near the Lower Band
Price near or below the lower band can indicate strong downside momentum.
It does not automatically mean the market is oversold and ready to bounce.
This distinction is critical.
In a range, band touches can support mean-reversion setups.
In a strong trend, price can repeatedly “walk the band.”
Bollinger Band Setup 1: The Squeeze
A Bollinger Band squeeze occurs when the upper and lower bands contract significantly.
It signals declining volatility.
Traders watch squeezes because periods of unusually low volatility are often followed by volatility expansion.
The squeeze does not predict direction.
It tells you that the market has become compressed.
What Does a Bollinger Band Squeeze Look Like?
Imagine a stock that has traded between ₹980 and ₹1,020 for several weeks.
Daily price swings become smaller.
The moving average flattens.
The upper and lower Bollinger Bands move closer together.
This is a volatility contraction.
The market is effectively building a narrow trading range.
If price later breaks decisively above ₹1,020 or below ₹980, the bands may begin expanding as volatility returns.
How to Trade a Bollinger Band Squeeze
A simple squeeze setup involves three stages.
Step 1: Identify Contraction
Look for bands that are visibly narrower than in the previous trading period.
The strongest squeezes often occur after volatility has declined for a meaningful period.
Do not judge band width in isolation.
Compare it with the asset’s recent history.
Step 2: Mark the Price Range
Identify nearby support and resistance.
For example:
- Resistance: ₹1,020
- Support: ₹980
The squeeze tells you volatility is low.
The range tells you where a directional breakout may become meaningful.
Step 3: Wait for Expansion
A trader may wait for:
- Price to close outside the range
- Bands to begin widening
- Volume to increase
- Momentum to confirm the move
The goal is to avoid entering simply because the bands are narrow.
A squeeze can remain compressed longer than expected.
Bollinger Band Squeeze Example
Suppose a stock trades around ₹500.
For several sessions, it stays between:
₹490 and ₹510
The Bollinger Bands narrow significantly.
Then price closes at ₹516 on higher-than-usual volume.
The upper band begins turning upward.
The next session opens near ₹518 and continues higher.
A breakout trader may interpret the combination of:
- Narrow prior bands
- Range breakout
- Expanding bands
- Increased volume
as stronger evidence than the squeeze alone.
What Is Bollinger Bandwidth?
Bollinger Bandwidth quantifies how wide the bands are.
A common simplified calculation is:
Bandwidth = (Upper Band – Lower Band) ÷ Middle Band × 100
Suppose:
- Upper band = ₹105
- Lower band = ₹95
- Middle band = ₹100
Then:
(₹105 – ₹95) ÷ ₹100 × 100 = 10%
If bandwidth later falls to 3%, volatility has contracted substantially.
There is no universal bandwidth level that means “buy now.”
A 4% bandwidth may be extremely narrow for one asset and normal for another.
Compare the reading with the same instrument’s historical values.
What Makes a Good Squeeze Setup?
A squeeze becomes more useful when several conditions align.
These can include:
- Clearly narrowing bands
- A defined consolidation range
- Declining realized volatility
- Price repeatedly respecting support and resistance
- A later breakout with stronger volume
- Bands beginning to expand after the breakout
The squeeze is the preparation phase.
The breakout is the trigger.
Bollinger Band Setup 2: Breakout Trading
A Bollinger Band breakout occurs when price moves outside one of the bands and continues in that direction as volatility expands.
The common mistake is assuming that price above the upper band must immediately reverse.
That is not how strong trends behave.
In a genuine bullish breakout, price can remain near or above the upper band for multiple candles.
In a bearish breakout, price can repeatedly trade near the lower band.
How Does a Bullish Bollinger Band Breakout Work?
A bullish setup may include:
- Prior consolidation
- Narrowing Bollinger Bands
- Price breaking above resistance
- A close above or near the upper band
- Expanding band width
- Rising volume
- Higher highs and higher lows after the breakout
Suppose a stock has resistance at ₹750.
It closes at ₹758 while the upper band is at ₹754.
That alone does not guarantee a valid breakout.
But if volume is strong, the bands begin to expand, and the price holds above ₹750 in subsequent sessions, the breakout becomes more convincing.
How Does a Bearish Bollinger Band Breakout Work?
The logic is reversed.
A bearish setup may include:
- A period of consolidation
- Narrow bands
- Price breaking below support
- A close below the lower band
- Bands expanding
- Increasing selling volume
- Lower highs and lower lows
Suppose support is ₹1,200.
Price closes at ₹1,175.
The lower band is ₹1,185.
If the next session fails to recover ₹1,200 and selling pressure remains strong, traders may interpret the move as a bearish expansion in volatility.
Should You Buy Every Close Above the Upper Band?
No.
A band breakout needs context.
Price can move above the upper Bollinger Band because of:
- A genuine trend breakout
- A temporary news spike
- Thin liquidity
- A short squeeze
- A failed breakout
- Random volatility
Look for confirmation from market structure rather than using the band in isolation.
Useful confirmation can include:
- Break of a clearly defined resistance level
- Strong closing price
- Higher trading volume
- Expanding band width
- Momentum confirmation
- Follow-through on the next candle
What Is a Bollinger Band Walk?
A band walk happens when price repeatedly trades near one Bollinger Band during a strong trend.
In an uptrend, price may keep touching or riding the upper band.
In a downtrend, price may continue near the lower band.
This matters because inexperienced traders often try to short every upper-band touch.
During a strong trend, that can lead to repeated losing trades.
Example of an Upper Band Walk
Suppose a stock moves:
- ₹100
- ₹104
- ₹108
- ₹112
- ₹117
Each session closes near the upper Bollinger Band.
A trader using simple mean reversion may repeatedly expect a fall.
But the pattern may actually indicate persistent buying pressure.
A better approach is to ask whether the broader trend is strong before attempting to fade the move.
How Can You Confirm a Bollinger Breakout?
No confirmation method eliminates false signals, but traders commonly combine Bollinger Bands with:
- Volume
- Support and resistance
- Relative Strength Index (RSI)
- Moving averages
- Average True Range (ATR)
- Price structure
- Candlestick closes
For example, a breakout above an upper band may carry more weight when:
- Price also clears multi-week resistance
- Volume is above average
- The middle band is rising
- Price closes near the high of the session
The idea is not to add ten indicators.
It is to confirm that the move represents genuine demand or supply rather than a brief price spike.
Bollinger Band Setup 3: Mean Reversion
A mean-reversion setup assumes that the price has moved unusually far from its recent average and may return toward that average.
With Bollinger Bands, the middle band often serves as the reference mean.
This approach tends to work better in:
- Sideways markets
- Established ranges
- Low-trend environments
- Markets where extremes repeatedly reverse
It tends to work poorly during powerful directional trends.
How Does a Bullish Mean Reversion Setup Work?
A bullish mean reversion setup may occur when:
- Price falls toward or below the lower Bollinger Band.
- The broader market is not in a strong downtrend.
- Price reaches nearby support.
- Selling momentum begins weakening.
- Price moves back inside the band.
A trader may then look for a move back toward the middle band.
Example
Suppose:
- Middle band = ₹1,000
- Lower band = ₹950
- Support = ₹945
Price falls to ₹942 intraday but closes back at ₹958.
The candle closes inside the lower band.
If the market remains range-bound, a trader may interpret this as a potential mean reversion setup toward the ₹1,000 middle band.
How Does a Bearish Mean Reversion Setup Work?
The logic reverses near the upper band.
Suppose:
- Middle band = ₹500
- Upper band = ₹530
- Resistance = ₹535
Price jumps to ₹538 but closes at ₹526.
If the market is not in a strong uptrend, that rejection may support a mean reversion setup toward the middle band.
Again, the upper-band touch alone is not enough.
The trader is looking for evidence that momentum has failed.
Why Mean Reversion Fails in Strong Trends
Mean reversion assumes that price will return toward its recent average.
Strong trends can invalidate that assumption for a long time.
Suppose a stock breaks out from ₹500 and rises to ₹650 over several weeks.
Its middle Bollinger Band keeps rising.
Price repeatedly touches the upper band.
A trader constantly shorting upper-band touches may accumulate losses because the “mean” itself is moving upward.
This is why trend context matters.
Before attempting mean reversion, ask:
Is price oscillating around a relatively stable average, or is the average itself trending strongly?
Bollinger Bands and RSI for Mean Reversion
Some traders combine Bollinger Bands with RSI to identify potential extremes.
For example, a bullish setup might involve:
- Price near the lower Bollinger Band
- RSI at a relatively low level
- Nearby support
- Bullish reversal candle
A bearish setup might involve:
- Price near the upper band
- High RSI
- Nearby resistance
- Bearish rejection
Do not treat an RSI reading below 30 or above 70 as an automatic reversal signal.
Strong trends can remain overbought or oversold for extended periods.
Squeeze vs Breakout vs Mean Reversion
These setups use the same indicator but make different assumptions.
| Setup | Market condition | What trader expects | Main risk |
|---|---|---|---|
| Squeeze | Low volatility | Large move may be approaching | Entering before direction appears |
| Breakout | Volatility expanding | Trend continuation | False breakout |
| Mean reversion | Range-bound or stretched | Return toward average | Fading a strong trend |
The biggest mistake is using a mean-reversion strategy in a breakout environment, or a breakout strategy in a quiet range without confirmation.
How to Tell Whether the Market Is Trending or Ranging
You do not need a perfect classification.
Look at basic price behavior.
Signs of a Trend
- Higher highs and higher lows in an uptrend
- Lower highs and lower lows in a downtrend
- Sloping middle Bollinger Band
- Price spending more time on one side of the middle band
- Repeated band walks
- Expanding volatility
Signs of a Range
- Repeated support and resistance
- Flat middle band
- Price regularly crossing the middle band
- Failed moves outside the outer bands
- No consistent sequence of higher or lower swings
Mean reversion usually makes more sense in the second environment.
Breakouts become more relevant when the range finally fails.
What Is a False Bollinger Band Breakout?
A false breakout occurs when price moves outside an important level or Bollinger Band but quickly returns inside the prior range.
Suppose resistance is ₹1,000.
Price trades at ₹1,015 and closes above the upper band.
The following session:
- Price falls below ₹1,000
- Volume weakens
- The upper band stops expanding
The breakout has failed.
A trader who bought solely because price crossed the upper band may be trapped.
How Can You Reduce False Breakout Risk?
You cannot remove it completely.
You can require stronger evidence before entering.
Possible filters include:
Wait for a Close
Intraday price can briefly move outside a band and reverse.
Waiting for the candle to close reduces sensitivity to temporary spikes.
Check Horizontal Levels
A band breakout that also breaks a major resistance or support level generally provides more context than a random band crossing.
Look at Volume
Higher volume can indicate stronger market participation.
Low-volume breakouts may be less convincing.
Watch Follow-Through
Some traders wait for the next candle to confirm that price can stay outside or above the broken range.
The trade-off is entering later.
Avoid Chasing an Already Extended Candle
If price has already moved far beyond the upper band, the reward-to-risk ratio may be worse even if the breakout itself is valid.
How Do You Set a Stop-Loss With Bollinger Bands?
There is no single Bollinger Band stop-loss rule.
The stop should relate to why you entered the trade.
For a Breakout Trade
Possible invalidation points include:
- Back below the broken resistance level
- Back inside the prior range
- Below the breakout candle
- Below a nearby swing low
For Mean Reversion
Possible invalidation points include:
- Below established support for a bullish trade
- Above established resistance for a bearish trade
- Beyond the reversal candle
- Beyond a predefined volatility-based stop
Avoid stopping at an arbitrary percentage just because the Bollinger Band is there.
The better question is:
At what price would my original setup clearly be wrong?
How Can Bollinger Bands Be Used for Profit Targets?
Targets depend on the setup.
Mean Reversion Target
The middle band is a common first reference point.
If price rebounds from the lower band, the trader may initially look toward the moving average.
The opposite applies after an upper-band rejection.
Breakout Target
The middle band is often less useful because a breakout trader expects price to continue away from the previous average.
Instead, targets might be based on:
- Previous swing levels
- Range height
- Trailing stops
- Risk-to-reward ratios
- Trend structure
A breakout strategy and mean reversion strategy should not use identical exit logic.
Bollinger Band Breakout Example
Suppose a stock has traded between ₹1,450 and ₹1,500 for two weeks.
The bands have narrowed sharply.
Then:
- Price closes at ₹1,515
- Upper band is ₹1,505
- Volume is 1.8 times its recent average
- Middle band begins turning upward
A trader buys at ₹1,518.
Suppose the invalidation level is below the old resistance at ₹1,495.
Risk per share:
₹1,518 – ₹1,495 = ₹23
If the trader targets ₹1,575:
Potential reward:
₹1,575 – ₹1,518 = ₹57
Approximate reward-to-risk ratio:
₹57 ÷ ₹23 = 2.48
The Bollinger Bands identified volatility expansion.
The actual risk decision came from price structure.
Bollinger Band Mean Reversion Example
Suppose a stock is trading in a range between ₹900 and ₹1,000.
Its Bollinger Bands are:
- Upper band: ₹998
- Middle band: ₹950
- Lower band: ₹902
Price falls to ₹895 intraday but closes at ₹908.
The trader sees:
- Lower-band penetration
- Support near ₹900
- Rejection of lower prices
- No established downtrend
A potential long entry might be considered around ₹910.
If the stop is ₹890:
Risk:
₹20 per share
If the target is the middle band at ₹950:
Potential reward:
₹40 per share
Reward-to-risk ratio:
2:1
If price instead breaks below ₹900 decisively, with expanding bands and strong selling, the mean-reversion thesis may no longer make sense.
Which Bollinger Band Settings Should You Use?
The classic setting is:
20 periods, 2 standard deviations
This is a starting point, not a universal optimum.
Traders may adjust settings based on:
- Timeframe
- Asset volatility
- Trading style
- Market behaviour
Shorter lookback periods make the bands react faster.
Longer periods make them smoother.
Increasing the standard deviation multiplier creates wider bands.
Reducing it creates narrower bands.
Avoid constantly changing settings simply to make past trades look better.
That can lead to overfitting.
Do Bollinger Bands Work for Intraday Trading?
Yes, traders use Bollinger Bands on intraday charts such as:
- 5-minute
- 15-minute
- 30-minute
- Hourly charts
The same principles apply.
However, lower timeframes generally contain more market noise.
A five-minute band breakout may fail more frequently than a carefully established daily-chart breakout.
Intraday traders should pay particular attention to:
- Opening volatility
- Volume
- Major support and resistance
- News events
- Market-wide trend
- Bid-ask spreads
Do Bollinger Bands Work for Options Trading?
Bollinger Bands analyze the underlying price, not option premium directly.
An options trader may use the bands to develop a view on:
- Direction
- Volatility expansion
- Potential breakout
- Mean reversion
Then choose an options structure that matches that view.
For example:
- A bullish breakout view may lead to a bullish options strategy
- Bearish breakout view may lead to a bearish strategy
- Expected volatility expansion without directional conviction may lead the trader to study volatility strategies
Options add variables such as time decay and implied volatility, so a correct Bollinger Band signal on the underlying does not guarantee a profitable options trade.
Do Bollinger Bands Predict Volatility?
They describe volatility based on recent price behavior.
They do not predict the future with certainty.
A squeeze tells you volatility has contracted.
It does not guarantee that:
- A breakout will occur tomorrow
- The move will be large
- The direction will be upward
- The first breakout will be genuine
Think of Bollinger Bands as a framework for interpreting price and volatility, not a forecasting machine.
What Are the Biggest Bollinger Band Trading Mistakes?
Selling Every Upper Band Touch
Price can ride the upper band during strong uptrends.
An upper-band touch is not automatically bearish.
Buying Every Lower Band Touch
A falling market can continue along the lower band.
A low price can become lower.
Trading the Squeeze Before a Breakout
A squeeze tells you volatility is compressed.
It does not tell you which direction to trade.
Ignoring Market Structure
Support, resistance, trend, and price swings often matter more than the band itself.
Using Mean Reversion During Strong Trends
This is one of the easiest ways to repeatedly trade against momentum.
Ignoring False Breakouts
A single candle outside the band is not proof of a sustainable move.
Overloading the Chart With Indicators
Bollinger Bands already combine trend and volatility information.
Adding too many indicators can make the decision process harder rather than better.
A Simple Bollinger Bands Trading Checklist
Before taking a trade, ask:
- Is the market trending or ranging?
- Are the bands contracting or expanding?
- Where are the nearest support and resistance levels?
- Is price merely touching a band or actually breaking market structure?
- Is volume confirming the move?
- Am I trading a breakout or mean reversion setup?
- Where is the setup invalidated?
- What is the potential loss in rupees?
- Is the potential reward worth that risk?
- What would make me exit even if my target has not been reached?
The most important question is number six.
A trader should know which Bollinger Band setup they are actually trading before entering.
Are Bollinger Bands a Complete Trading System?
Not by themselves.
Bollinger Bands can provide useful information about:
- Volatility
- Trend behaviour
- Price extremes
- Market contraction
- Market expansion
They do not automatically determine:
- Position size
- Maximum risk
- Fundamental catalysts
- Liquidity
- Execution quality
- Whether a breakout will succeed
A complete approach also needs risk management and clear entry and exit rules.
FAQs About Bollinger Bands
What are Bollinger Bands?
A. Bollinger Bands are a technical analysis indicator consisting of a moving average and upper and lower bands typically based on standard deviation. They expand when volatility rises and contract when volatility falls.
What is a Bollinger Band squeeze?
A. A Bollinger Band squeeze occurs when the upper and lower bands contract to unusually narrow levels. It indicates low volatility and can precede a period of volatility expansion, but it does not predict breakout direction.
Is a breakout above the upper Bollinger Band bullish?
A. It can be bullish when supported by factors such as a breakout above resistance, expanding bands, higher volume, and follow-through. A move above the upper band alone is not enough to confirm a trend.
Does touching the upper Bollinger Band mean sell?
A. No. During strong uptrends, price can repeatedly touch or follow the upper band. Selling solely because the upper band is reached can mean trading against momentum.
Does touching the lower Bollinger Band mean buy?
A. No. Price can continue falling along the lower band during a strong downtrend. A lower-band touch becomes more relevant for mean reversion when the broader market is range-bound, and reversal evidence appears.
What is the best Bollinger Band setting?
A. The classic setting is a 20-period simple moving average with bands set at 2 standard deviations. There is no single best setting for every asset, timeframe, or strategy.
What is Bollinger Band mean reversion?
A. Bollinger Band mean reversion is a setup that looks for price to return toward its recent average after moving unusually far toward or beyond an outer band. It generally works better in ranging markets than strong trends.
What is a Bollinger Band walk?
A. A band walk occurs when the price repeatedly moves near one of the outer bands during a strong trend. An upper-band walk can indicate sustained bullish momentum, while a lower-band walk can indicate sustained bearish momentum.
How do you avoid false Bollinger Band breakouts?
A. False breakouts cannot be eliminated, but traders can look for a close beyond support or resistance, stronger volume, expanding bands, and follow-through before entering.
Are Bollinger Bands useful for day trading?
A. They can be used for intraday trading, but lower timeframes tend to produce more noise and false signals. Combining band behavior with market structure, volume, and risk controls is particularly important.
Key Takeaways
- Bollinger Bands combine a moving average with volatility-based upper and lower bands.
- Narrowing bands indicate volatility contraction, while widening bands indicate expansion.
- A Bollinger Band squeeze can signal that a larger move may be approaching, but it does not predict direction.
- Breakout setups work best when price also breaks meaningful support or resistance and receives confirmation.
- A close above the upper band is not automatically a sell signal, and a close below the lower band is not automatically a buy signal.
- Mean-reversion setups generally make more sense in range-bound markets than in strong trends.
- During strong trends, price can repeatedly “walk” an outer band.
- Volume, support, resistance, and price structure can help filter false breakouts.
- Stop-loss placement should reflect where the trade thesis becomes invalid rather than the position of the Bollinger Band alone.
- The most important step is to identify whether you are trading a contraction, a breakout momentum, or a mean reversion before entering.
Disclaimer
The stocks mentioned in this article are not recommendations. Please conduct your own research and due diligence before investing. Investment in securities market are subject to market risks, read all the related documents carefully before investing. Please read the Risk Disclosure documents carefully before investing in Equity Shares, Derivatives, Mutual fund, and/or other instruments traded on the Stock Exchanges. As investments are subject to market risks and price fluctuation risk, there is no assurance or guarantee that the investment objectives shall be achieved. Lemonn (Formerly known as NU Investors Technologies Pvt. Ltd) do not guarantee any assured returns on any investments. Past performance of securities/instruments is not indicative of their future performance.
Related Posts

Download Lemonn
Download my trading app for SIP, demat account services—get a free demat account with our demat apps.



