
India GDP Old vs New Series: What Changed and Why
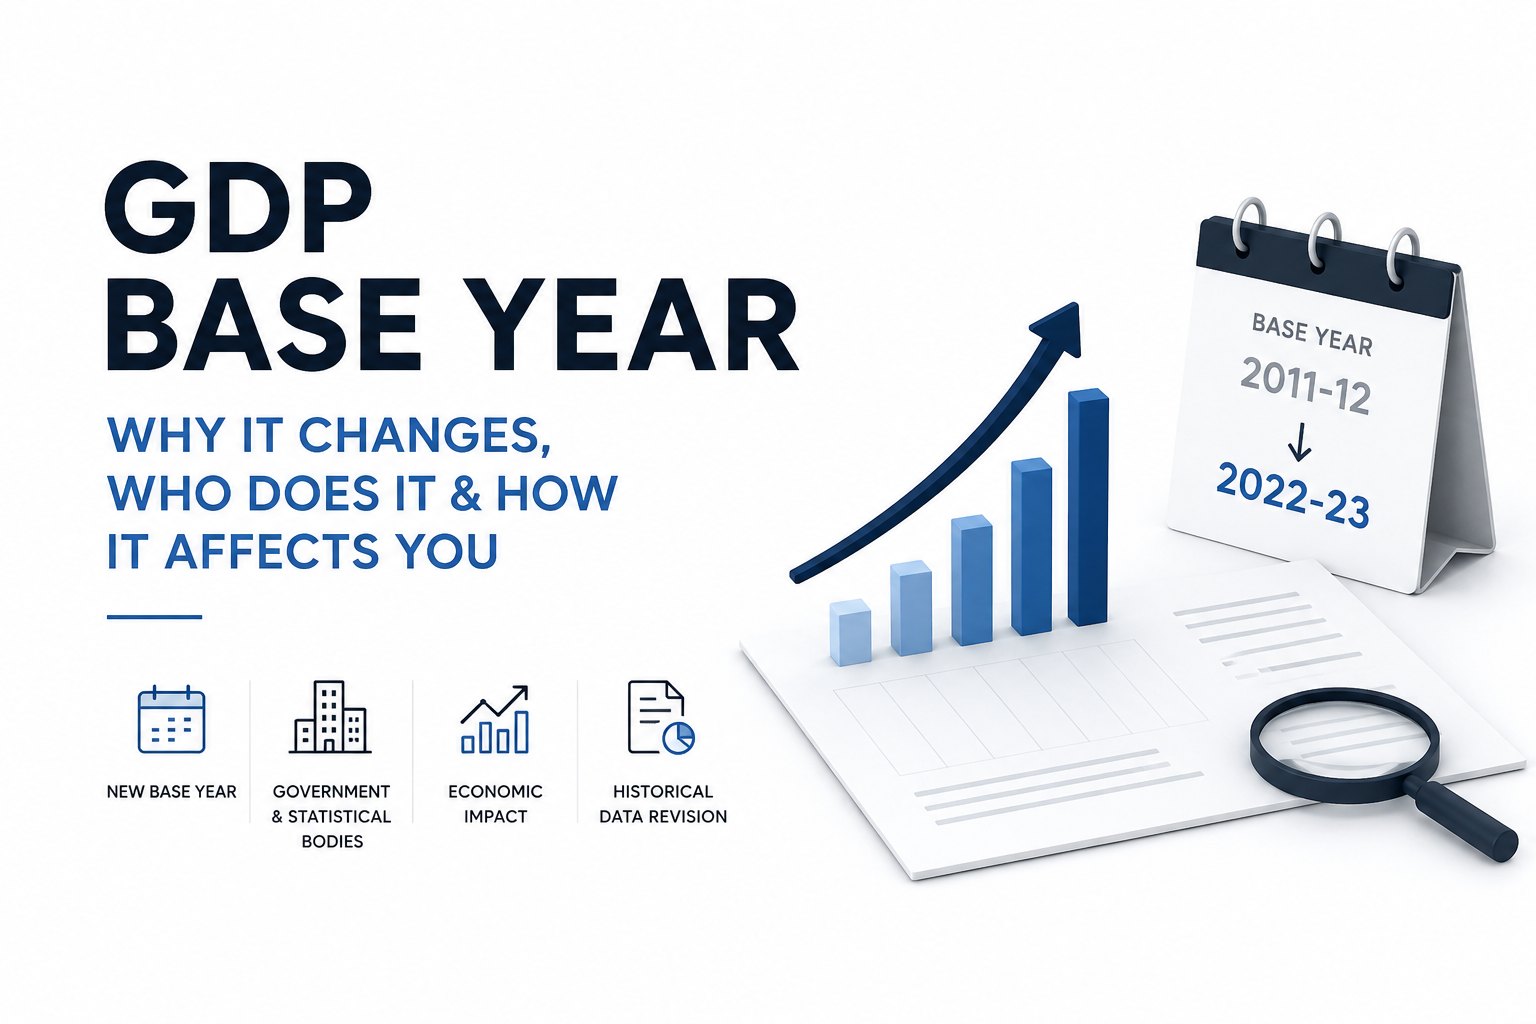
India’s new GDP series has significantly changed our picture of recent economic growth. After the base year moved from 2011-12 to 2022-23, real GDP growth for FY 2023-24 was revised from 9.2% to 7.2%, while FY 2024-25 growth moved in the opposite direction, from 6.5% to 7.1%.
That does not mean India’s actual economic activity suddenly changed. The statistical lens changed. New data sources, classifications, price-adjustment methods and estimation techniques produced a different measurement of the same economy.
For investors, businesses and anyone tracking India’s economy, understanding that distinction is critical.
India GDP old vs new series at a glance
Here is the clearest example of how much a base-year revision can change the economic narrative.
| Financial year | Old 2011-12 series | New 2022-23 series | Change |
|---|---|---|---|
| 2023-24 | 9.2% | 7.2% | -2.0 percentage points |
| 2024-25 | 6.5% | 7.1% | +0.6 percentage points |
| 2025-26* | 7.4% | 7.6% | +0.2 percentage points |
*The 2025-26 comparison reflects estimates available when the new series was initially released.
The most striking revision was FY 2023-24.
Under the previous 2011-12 series, real GDP growth for that year stood at 9.2%. Under the new methodology, it was 7.2%.
But notice what happened the following year.
FY 2024-25 growth was revised up, from 6.5% to 7.1%.
So, rebasing GDP does not systematically increase or decrease reported growth. It can move estimates in either direction.
Why did India’s GDP growth numbers change?
Changing the GDP base year is more complicated than replacing 2011-12 prices with 2022-23 prices.
MoSPI says the new series incorporates changes including:
- revised estimation methodology
- new high-frequency indicators
- improved deflation strategies
- newer data sources
- updated economic classifications
- methodological and conceptual improvements
These changes can affect both the level of GDP and its growth rate.
That is why the new series can tell a noticeably different story about a particular year.
“Start investing with confidence! Explore
0 demat account
and grow your wealth.”
What does changing from 9.2% to 7.2% actually mean?
This is where GDP rebasing becomes easier to understand.
Imagine an analyst said:
The Indian economy grew 9.2% in FY 2023-24.
That statement was correct according to the 2011-12 GDP series.
Under the new 2022-23 series, however, the same year’s real GDP growth is estimated at 7.2%.
The economy did not travel back in time and grow less.
Instead, statisticians now have a different estimate of:
- how large the economy was at the beginning of the period
- how much output different sectors produced
- what part of the increase came from prices
- what part represented real increases in production
- how different activities should be classified
This distinction is important whenever you see headlines saying India’s GDP has been “revised”.
Why did FY 2023-24 GDP growth fall so sharply?
One major reason is the way nominal economic activity is converted into real economic activity.
Nominal GDP includes the effects of both output and prices.
Real GDP tries to remove the price effect.
That sounds straightforward, but deciding which price index to use for each economic activity is technically difficult.
The deflator problem
Suppose a manufacturer produces goods worth ₹120 crore this year compared with ₹100 crore previously.
That 20% increase does not necessarily mean real production increased by 20%.
Part of it may simply be higher prices.
Statisticians therefore use price indices, or deflators, to separate price movements from actual changes in production.
If the price adjustment changes, the resulting real growth estimate can also change.
The 2022-23 series introduced an improved deflation strategy as one of its major methodological changes.
Double deflation matters
One particularly important improvement concerns the treatment of output and inputs.
Under double deflation, output and intermediate inputs can be adjusted for price changes separately before calculating real value added.
Why does that matter?
Imagine a steel producer’s selling prices fall while the cost of its inputs behaves differently.
Using one broad price index for the entire calculation may not accurately capture the company’s real value addition.
Separately adjusting output and inputs can provide a different, and potentially more representative, estimate.
The shift in deflation methodology is therefore one reason investors should not assume that differences between the old and new GDP series are merely cosmetic.
The new series changed quarterly GDP growth too
The effect was not limited to annual GDP.
Some quarterly growth rates changed materially after the new methodology was introduced.
For example:
| Period | Old series | New series |
|---|---|---|
| Q1 FY 2025-26 | 7.8% | 6.7% |
| Q2 FY 2025-26 | 8.2% | 8.4% |
Again, notice that the revisions move in both directions.
Q1 growth was revised substantially downward, while Q2 was revised slightly upward.
This is why economists should avoid mixing quarterly numbers calculated under two different GDP series.
Did India’s nominal GDP also change?
Yes.
And for fiscal analysis, changes in nominal GDP can be just as important as changes in real GDP growth.
Real GDP helps answer:
How fast is actual economic output growing after adjusting for prices?
Nominal GDP helps answer:
What is the economy worth at current market prices?
Government debt, fiscal deficit, tax collections and many other indicators are often compared with nominal GDP.
If nominal GDP is revised, those ratios can change even when the underlying debt or deficit does not.
Why lower nominal GDP can increase the fiscal deficit ratio
Consider a simplified example.
Suppose the government’s fiscal deficit is:
₹15 lakh crore
If nominal GDP is:
₹350 lakh crore
then:
Fiscal deficit-to-GDP = 4.29%
Now suppose revised statistical estimates put GDP at:
₹335 lakh crore
while the fiscal deficit remains exactly ₹15 lakh crore.
The ratio becomes:
4.48%
Nothing happened to the ₹15 lakh crore deficit.
The denominator became smaller.
That alone made the fiscal position look weaker relative to GDP.
This is one reason the GDP revision attracted attention beyond economists and statisticians.
What happens to India’s debt-to-GDP ratio?
Exactly the same denominator effect applies.
The formula is:
Debt-to-GDP ratio = Government debt ÷ Nominal GDP × 100
Suppose government debt is ₹200 lakh crore.
| Scenario | Government debt | Nominal GDP | Debt-to-GDP |
|---|---|---|---|
| Before revision | ₹200 lakh crore | ₹350 lakh crore | 57.1% |
| After revision | ₹200 lakh crore | ₹335 lakh crore | 59.7% |
The government did not borrow an additional rupee in this example.
Yet debt-to-GDP increased by around 2.6 percentage points because estimated GDP became smaller.
This illustrates why GDP revisions can matter for fiscal policy.
Which other ratios can change after GDP rebasing?
GDP appears in the denominator of many indicators used by governments, economists and investors.
A revision can affect:
- fiscal deficit-to-GDP
- government debt-to-GDP
- tax-to-GDP
- bank credit-to-GDP
- household consumption-to-GDP
- investment-to-GDP
- exports-to-GDP
- corporate profits-to-GDP
- market capitalisation-to-GDP
The underlying numerator may remain unchanged.
The ratio changes because GDP changed.
Does the new GDP series change India’s $4 trillion economy calculation?
Potentially, yes.
When people ask whether India is a “$4 trillion economy”, they are generally referring to nominal GDP converted into US dollars.
That calculation depends broadly on:
Nominal GDP in rupees ÷ rupee-dollar exchange rate
If nominal GDP is revised lower, the dollar value of GDP can also be lower, assuming the exchange rate is unchanged.
This is another reason nominal GDP revisions matter even when the debate is mostly focused on the real GDP growth rate.
What changed at the sector level?
The new series does not simply revise total GDP.
It can change the estimated contribution and growth of individual industries.
MoSPI’s comparison of the old and new series covers sectors including:
- agriculture and allied activities
- mining and quarrying
- manufacturing
- electricity and utilities
- construction
- trade
- transport
- financial services
- real estate
- professional services
- public administration and other services
Several methodological and data changes operate at the industry level.
Agriculture
The revised framework incorporates updates such as additional fruits and vegetables, revised estimates for grass and fodder, updated input values and improved state-level price information.
Even seemingly small changes can matter because agriculture represents a significant part of India’s GVA.
Manufacturing
Manufacturing is particularly important because estimating real value added requires distinguishing between the value of output and the value of inputs.
Improved deflation methods can therefore change the estimated real growth of manufacturing even when the underlying company financial statements have not changed.
Services
India’s economy has also become increasingly services-heavy.
One methodological issue involves companies that conduct more than one type of activity.
For example, a large company may manufacture physical products but also earn money from:
- software
- maintenance
- financing
- consulting
- logistics
- digital services
The new framework improves the separation of manufacturing and service activities within such enterprises, making sector classification more precise.
Does the GDP revision change company revenue or profits?
No.
Suppose an Indian company reported:
- revenue of ₹50,000 crore
- EBITDA of ₹8,000 crore
- profit after tax of ₹5,000 crore
A GDP base-year change does not rewrite those financial statements.
Revenue remains ₹50,000 crore.
Profit remains ₹5,000 crore.
The GDP revision changes the macroeconomic statistics surrounding the company, not the company’s audited accounts.
Then why should investors care?
Because investors frequently compare company performance with the economy.
Suppose a consumer company increased sales by 10% when nominal consumption growth was believed to be 8%.
An analyst might conclude that the company was gaining market share.
But if the underlying macroeconomic series is revised, that comparison could change.
The same applies when comparing:
- bank credit growth with nominal GDP
- corporate profit growth with GDP
- auto sales with consumption growth
- cement demand with construction GVA
- IT revenue with services growth
- capital expenditure with investment growth
GDP rebasing therefore does not change company earnings directly, but it can change the benchmark against which those earnings are evaluated.
Can GDP rebasing change stock valuations?
Not directly.
There is no formula saying:
GDP revised down 1% = Nifty falls 1%
Stock prices are ultimately driven by factors such as:
- earnings
- cash flows
- interest rates
- valuations
- growth expectations
- risk
- liquidity
But GDP data influences expectations about several of those variables.
A persistent upward revision to manufacturing growth, for example, might strengthen the macro case for industrial companies.
A downward revision to consumption growth could make analysts more cautious about consumer demand.
The effect is therefore indirect.
Does the new GDP data change India’s growth story?
It changes parts of the story, but not necessarily the broader conclusion.
Under the old series, FY 2023-24 looked exceptionally strong at 9.2% growth.
The new series estimates growth at 7.2%.
But FY 2024-25 moved from 6.5% to 7.1%.
The pattern therefore changed from:
9.2% → 6.5%
to:
7.2% → 7.1%
That tells a noticeably different economic story.
The old data suggested a very strong FY 2023-24 followed by a sharp slowdown.
The new data suggests growth was considerably more stable across the two years.
This is arguably one of the most important insights from the entire GDP rebasing exercise.
Why historical GDP comparisons are tricky right now
There is still one missing piece.
India does not yet have the complete historical back series based on 2022-23.
MoSPI has said the back series is expected by December 2026.
Until it arrives, researchers need to be cautious when comparing the latest numbers with much older growth rates.
For example, a chart showing:
- GDP growth in 2005
- GDP growth in 2015
- GDP growth in 2024
- GDP growth in 2026
may combine estimates created under different statistical frameworks.
That does not automatically make the chart useless, but the methodology needs to be clearly disclosed.
What will India’s GDP back series do?
The back series will attempt to create historical GDP estimates that are consistent, as far as possible, with the new 2022-23 methodology.
MoSPI has indicated that the exercise will use a combination of recalculation and splicing, with the final methodology determined in consultation with its advisory committee.
Recalculation
Where adequate historical data exists, GDP can potentially be recalculated using the revised methodology.
Splicing
For much older periods, the detailed datasets needed by today’s methodology may simply not exist.
Statisticians can instead link the growth pattern of the older series to the newer series.
This process is called splicing.
MoSPI has said that, following past practice, estimates may be recalculated using the new methodology up to the immediately preceding base and then spliced at a disaggregated level further back, potentially to 1950-51.
Why the back series could become controversial
Historical GDP data is not merely academic.
It is frequently used to compare:
- different governments
- economic reforms
- recessions
- investment cycles
- employment periods
- productivity
- India’s performance against other countries
If the new methodology materially changes growth estimates for previous decades, some historical narratives could change as well.
That does not necessarily mean one series is “politically better” or “worse”.
The useful question is whether the methodology is transparent, consistent and supported by the best available data.
Has this happened before?
Yes.
When India moved from the 2004-05 base year to 2011-12, historical growth estimates also changed.
The 2011-12 series incorporated important methodological changes and substantially expanded corporate-sector coverage.
This is a recurring feature of statistical rebasing.
As economies become more complex and better data becomes available, the statistical picture of the past can change.
That is why GDP should be understood as an estimate of economic activity, not a perfect count of every rupee produced.
A newer example: GDP estimates can keep changing
There is another important lesson for investors.
Even after a new base series is introduced, GDP numbers are not frozen permanently.
MoSPI subsequently updated estimates under the 2022-23 series as additional information, including revised price and industrial-production measures, became available.
For example, updated official figures published in September 2026 put real GDP growth at:
- 7.3% for FY 2023-24
- 7.2% for FY 2024-25
- 7.8% for FY 2025-26
The previously released estimates under the same new series were 7.2%, 7.1% and 7.7%, respectively.
That distinction is important.
A base-year revision changes the broader statistical framework.
A regular GDP revision updates estimates as newer or better data becomes available.
Both can change headline numbers, but they happen for different reasons.
How should investors read GDP data after rebasing?
A practical approach is to ask five questions whenever a GDP number is released.
1. Is this nominal GDP or real GDP?
Real GDP tells you more about actual output growth.
Nominal GDP matters more for ratios such as debt-to-GDP and for understanding the rupee value of the economy.
2. Which base year is being used?
For India’s current series, that is 2022-23.
Be careful when comparing it with numbers calculated under the 2011-12 series.
3. Is the number an advance, provisional or revised estimate?
GDP figures evolve as better data arrives.
The first estimate should not automatically be treated as the final number.
4. Which sectors drove the change?
Headline GDP can hide very different underlying trends.
Manufacturing may be accelerating while agriculture slows, or services may be carrying overall growth.
Sector GVA often provides more useful information for investors than the headline alone.
5. Has the historical series been revised?
If yes, update the entire dataset used in your analysis rather than replacing only the latest year’s number.
Otherwise, you risk comparing apples with oranges.
Old vs new GDP series: what really matters?
The most important lesson from India’s GDP base-year change is not whether one particular growth number went up or down.
It is that economic data depends on how economic activity is measured.
The change from the 2011-12 series to the 2022-23 series produced a striking example.
FY 2023-24 went from 9.2% growth to 7.2%, while FY 2024-25 went from 6.5% to 7.1% in the initial new-series estimates.
The resulting story looks different.
Instead of an extraordinary growth spike followed by a sharp slowdown, the revised numbers indicate much steadier growth across those two years.
For investors, businesses and policymakers, that is precisely why methodology matters.
FAQs
Why did India’s GDP growth change from 9.2% to 7.2%?
India changed its GDP base year from 2011-12 to 2022-23 and introduced new datasets, classifications and methodologies. Under the initial new series, FY 2023-24 real GDP growth was estimated at 7.2%, compared with 9.2% under the previous series.
Did India’s economy actually shrink because GDP was revised?
No. A statistical revision changes the estimate of economic activity. It does not mean factories produced fewer goods retroactively or companies suddenly lost historical revenue.
Did all GDP growth rates fall after the base-year change?
No. FY 2024-25 provides the clearest counterexample. Its growth estimate increased from 6.5% under the old series to 7.1% in the initial 2022-23 series.
Does GDP rebasing affect company profits?
Not directly. A company’s reported revenue, expenses and profit do not change because the GDP methodology changes. However, sector growth and macroeconomic benchmarks used to evaluate the company may change.
Can GDP rebasing affect the fiscal deficit?
It can change the fiscal deficit as a percentage of GDP. If nominal GDP is revised downward while the rupee value of the deficit remains unchanged, the fiscal deficit-to-GDP ratio increases.
Can India’s debt-to-GDP ratio change after GDP rebasing?
Yes. GDP is the denominator in the debt-to-GDP calculation. A change in nominal GDP can therefore change the ratio even without any change in the amount of government debt.
What is India’s current GDP base year?
India’s current GDP series uses 2022-23 as the base year, replacing 2011-12. The new series was released in February 2026.
When will India’s historical GDP back series be released?
MoSPI has said the 2022-23 base-year back series is expected by December 2026. It should provide a more consistent basis for comparing current GDP estimates with India’s longer economic history.
Why do GDP numbers keep getting revised?
Early GDP estimates are calculated before all economic data is available. As more complete company, government, production, price and survey data arrives, MoSPI updates the estimates. Base-year changes go further by also changing parts of the methodology and statistical framework.
Key takeaways
- India changed its GDP base year from 2011-12 to 2022-23.
- FY 2023-24 real GDP growth was initially revised from 9.2% to 7.2% under the new series.
- FY 2024-25 moved the other way, from 6.5% to 7.1%.
- The new numbers changed the growth narrative from a sharp spike and slowdown to a more stable growth pattern.
- Rebasing can change both real and nominal GDP estimates.
- Lower nominal GDP can mechanically increase ratios such as fiscal deficit-to-GDP and debt-to-GDP.
- Company revenue and profits do not change because GDP is rebased, but the economic benchmarks investors use to analyse companies can change.
- Sector-level growth can also be revised because of better data, classifications and price-adjustment methods.
- GDP figures continue to undergo regular revisions even after a new base year is introduced.
- As of the latest September 2026 update, official real GDP growth estimates stand at 7.3% for FY 2023-24, 7.2% for FY 2024-25 and 7.8% for FY 2025-26.
- India’s complete 2022-23-based historical back series is expected in December 2026.
Disclaimer
The stocks mentioned in this article are not recommendations. Please conduct your own research and due diligence before investing. Investment in securities market are subject to market risks, read all the related documents carefully before investing. Please read the Risk Disclosure documents carefully before investing in Equity Shares, Derivatives, Mutual fund, and/or other instruments traded on the Stock Exchanges. As investments are subject to market risks and price fluctuation risk, there is no assurance or guarantee that the investment objectives shall be achieved. Lemonn (Formerly known as NU Investors Technologies Pvt. Ltd) do not guarantee any assured returns on any investments. Past performance of securities/instruments is not indicative of their future performance.
Related Posts

Download Lemonn
Download my app for share market trading, ipo investment, trading account, and all your investment needs.



