
40% of Mutual Fund Schemes Fell in FY26: What It Means
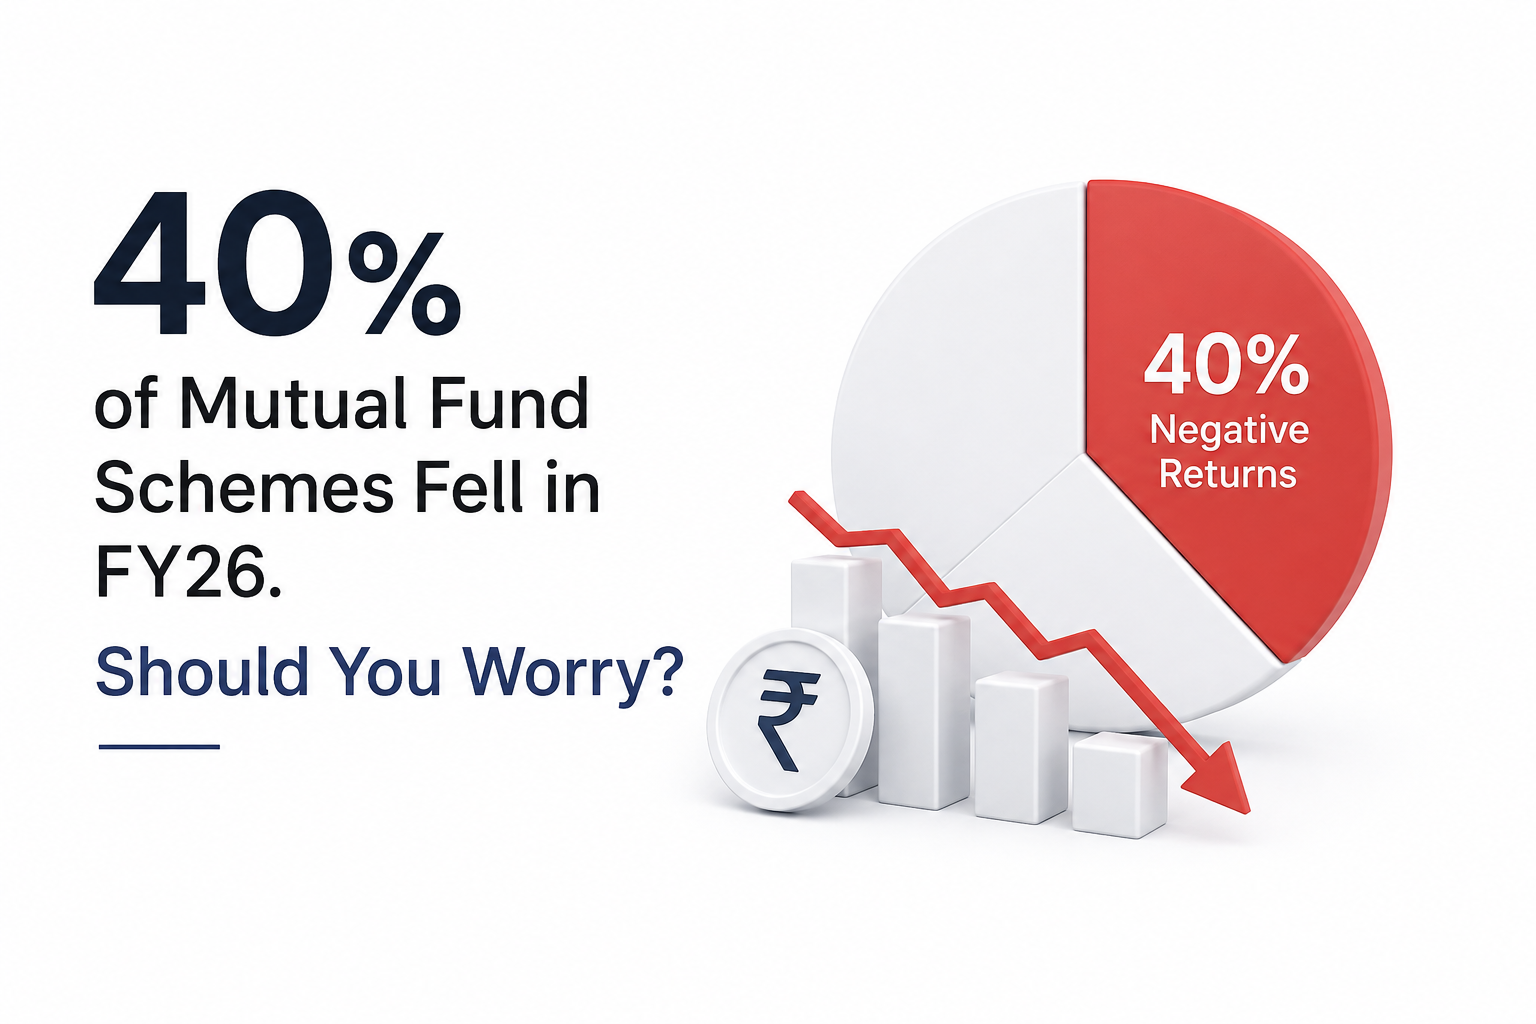
Nearly four in 10 mutual fund schemes delivered negative returns in FY26, a sharp increase from the previous financial year, according to data in SEBI’s Annual Report 2025-26.
Of the 1,841 schemes covered across SEBI’s return buckets, 731 ended FY26 with negative returns, compared with just 243 schemes in FY25. That means roughly 39.7% of schemes were in the red.
The numbers may look alarming, but there is an important detail for investors. Most of the loss-making schemes fell by less than 5%, and a negative one-year return alone does not necessarily signal that a mutual fund is performing poorly.
Mutual fund schemes in the red nearly tripled in FY26
SEBI’s data, which looks at annual returns for Direct Plan Growth options, shows a clear deterioration in mutual fund returns during FY26.
The number of schemes with negative returns rose from 243 in FY25 to 731 in FY26, almost a threefold increase.
At the same time, the number of schemes generating returns above 10% dropped from 304 to 198.
Here is the full return distribution:
| Annual return | FY25 schemes | FY26 schemes |
|---|---|---|
| -10% or lower | 30 | 93 |
| Above -10% to -5% | 41 | 146 |
| Above -5% to 0% | 172 | 492 |
| Above 0% to 5% | 218 | 373 |
| Above 5% to 10% | 852 | 539 |
| Above 10% | 304 | 198 |
The biggest increase came in schemes returning between -5% and 0%. Their number jumped from 172 in FY25 to 492 in FY26.
That detail puts the headline number into perspective.
Of the 731 schemes with negative returns, about two-thirds lost less than 5%. Meanwhile, 93 schemes recorded losses of 10% or more.
Why did mutual fund returns weaken in FY26?
The weaker numbers came during a volatile period across financial markets.
Mutual fund returns depend on the value of the securities held by each scheme. Equity funds can decline when stock markets fall, while debt, international, commodity and hybrid schemes respond to their respective underlying markets.
Volatility was particularly visible toward the end of FY26.
According to AMFI’s March 2026 industry data, total mutual fund assets under management fell 10.1% during March to ₹73.73 lakh crore, partly due to mark-to-market losses amid global market turmoil.
Despite that monthly decline, industry AUM remained about 12% higher than a year earlier.
The combination of market volatility and weaker asset prices meant many schemes finished the financial year with disappointing one-year numbers.
“Start investing with confidence! Explore the best
mutual funds
and grow your wealth.”
Should investors worry about the 40% figure?
The 40% figure is a reason to review portfolios, not necessarily a reason to exit mutual funds.
A scheme posting a negative return over one financial year does not automatically mean its investment strategy has failed.
The key is to understand how the fund performed relative to its benchmark and comparable schemes.
For example, suppose a fund loses 6% while its benchmark falls 10%. The investor has suffered a negative absolute return, but the fund has still outperformed its benchmark.
Now consider a fund that falls 12% when its benchmark is down only 5%. If similar underperformance continues over longer periods, investors may have more reason to investigate.
That is why judging a mutual fund purely on whether its one-year return is positive or negative can be misleading.
Investors kept putting money into equity funds
The weaker performance did not result in investors abandoning equity mutual funds.
AMFI data shows equity-oriented schemes recorded ₹40,450 crore in net inflows during March 2026, marking the 61st consecutive month of positive equity fund inflows.
SIP assets stood at approximately ₹15.11 lakh crore, accounting for about 20.5% of total mutual fund industry assets.
The continued inflows suggest many investors remained invested despite market volatility and weaker short-term returns.
That matters because SIPs are generally used for long-term investing rather than predicting short-term market movements.
Should you stop your SIP after negative returns?
For long-term investors, a negative year alone is usually not a sufficient reason to stop an SIP.
When a scheme’s NAV declines, a fixed SIP amount buys more units.
Consider a simple example:
| Month | NAV | Units bought with ₹10,000 |
| Month 1 | ₹100 | 100 |
| Month 2 | ₹80 | 125 |
| Month 3 | ₹70 | 142.9 |
Buying more units at lower NAVs does not guarantee a profit. Markets can remain weak, and individual schemes can underperform for extended periods.
However, stopping an SIP simply because NAVs have fallen can defeat the purpose of systematic long-term investing.
A better reason to stop or change an SIP would be a change in your financial goal, risk tolerance, asset allocation, or confidence in the scheme itself.
What should investors check now?
Rather than reacting to the FY26 headline, investors can use the latest numbers as a prompt for a portfolio review.
Compare your fund with its benchmark
A negative absolute return does not tell the full story.
Check whether the scheme has beaten or lagged its stated benchmark over appropriate periods. For equity funds, looking at three-year, five-year and rolling returns can provide more context than a single financial year’s performance.
Compare it with similar funds
A small-cap fund should not be compared with a large-cap fund simply because one performed better in FY26.
Different categories take different levels and types of risk.
Compare a scheme with funds operating under broadly similar mandates.
Check whether underperformance is persistent
One difficult year can happen even with a well-managed fund.
Consistent underperformance across different market periods is more significant.
If a scheme repeatedly trails its benchmark and comparable funds over several relevant periods, investors may need to understand why.
Look for changes inside the fund
Performance is not the only thing that matters.
Check for significant changes such as:
- A new fund manager
- A shift in investment strategy
- Higher portfolio concentration
- Changes in asset allocation
- A change in the scheme’s risk profile
- Rising costs
The question is whether the scheme you own today still matches the reason you originally invested in it.
Check the Riskometer
SEBI requires mutual fund schemes to disclose their risk level through the Riskometer.
An investor who is uncomfortable with sharp short-term losses may have a bigger problem if most of their portfolio is invested in very-high-risk equity schemes.
In such cases, the issue may be asset allocation rather than the performance of one particular fund.
Should you switch out of an underperforming mutual fund?
Switching funds solely because another scheme performed better in FY26 can be risky.
Last year’s best-performing category or fund may not remain on top.
Before switching, investors should ask:
- Has the scheme consistently lagged its benchmark?
- Has it performed worse than comparable funds?
- Has its investment strategy materially changed?
- Does its risk level still suit the investor?
- Is the financial goal approaching?
- What tax and exit-load costs would switching create?
A mutual fund switch generally involves redeeming units from one scheme and investing in another. The redemption can trigger capital gains tax depending on the type of fund, holding period and applicable tax rules.
An exit load may also apply.
What the FY26 mutual fund numbers really tell investors
The sharp rise in negative-return schemes is significant.
Schemes in the red increased from 243 in FY25 to 731 in FY26, while schemes delivering returns above 10% fell from 304 to 198.
But the data does not show that mutual funds as a whole have suddenly become poor investments.
It shows something more basic: market-linked investments can have bad years.
For investors, the more useful test is whether a fund is doing what it was selected to do.
A scheme that falls during a broad market correction but remains competitive with its benchmark may require patience. A scheme that consistently underperforms its benchmark and peers, takes excessive risk, or no longer matches an investor’s goal deserves closer attention.
FY26’s 40% figure makes for a striking headline. Investment decisions, however, need more context than one year’s return.
FAQs
How many mutual fund schemes gave negative returns in FY26?
SEBI’s FY26 return distribution shows 731 schemes delivered negative annual returns, compared with 243 schemes in FY25.
What percentage of mutual fund schemes were negative in FY26?
Of the 1,841 schemes across SEBI’s return buckets, 731 had negative returns. That works out to approximately 39.7%, or nearly four in every 10 schemes.
How many mutual funds lost more than 10% in FY26?
SEBI’s data shows 93 schemes recorded returns of -10% or lower in FY26, up from 30 schemes in FY25.
Does a negative mutual fund return mean I should sell?
Not necessarily. Investors should consider benchmark performance, category performance, longer-term returns, risk, portfolio changes and their own financial goals before deciding to redeem.
Should I stop my SIP if my mutual fund is falling?
A market decline alone is generally not enough to judge whether an SIP should be stopped. For long-term investors, lower NAVs mean each fixed SIP instalment purchases more units. The scheme’s suitability and the investor’s financial goal remain more important.
How should I judge an underperforming mutual fund?
Compare the fund with its stated benchmark and similar schemes over appropriate multi-year periods. Also examine rolling returns, portfolio composition, risk, expenses, fund manager changes and consistency.
Is it safe to invest in mutual funds after FY26 losses?
Mutual funds are market-linked and do not guarantee returns. Whether a scheme is suitable depends on its category, risk level, investment horizon and the investor’s financial goals. One weak financial year alone does not determine future performance.
Key takeaways
- 731 mutual fund schemes posted negative returns in FY26, up sharply from 243 in FY25.
- Roughly 39.7% of the 1,841 schemes in SEBI’s return distribution were in negative territory.
- Most loss-making schemes were down less than 5%, with 492 schemes in the -5% to 0% range.
- The number of schemes returning more than 10% dropped from 304 to 198.
- Investors continued investing in equity mutual funds despite market volatility.
- A negative one-year return should not automatically trigger redemption or stopping an SIP.
- Benchmark performance, peer comparison, long-term consistency and suitability are more useful measures for judging a fund.
- Persistent underperformance or a mismatch with your financial goals is a stronger reason to reconsider an investment.
Mutual fund investments are subject to market risks. This article is for educational purposes and is not personalised investment advice.
Disclaimer
The stocks mentioned in this article are not recommendations. Please conduct your own research and due diligence before investing. Investment in securities market are subject to market risks, read all the related documents carefully before investing. Please read the Risk Disclosure documents carefully before investing in Equity Shares, Derivatives, Mutual fund, and/or other instruments traded on the Stock Exchanges. As investments are subject to market risks and price fluctuation risk, there is no assurance or guarantee that the investment objectives shall be achieved. Lemonn (Formerly known as NU Investors Technologies Pvt. Ltd) do not guarantee any assured returns on any investments. Past performance of securities/instruments is not indicative of their future performance.
Related Posts


Download Lemonn
Download my mutual fund app - your mutual funds, stock, invest in ipo, mf, trade invest hub with demat account features.



