
Failure Swing Pattern: RSI Signals and Trading Guide
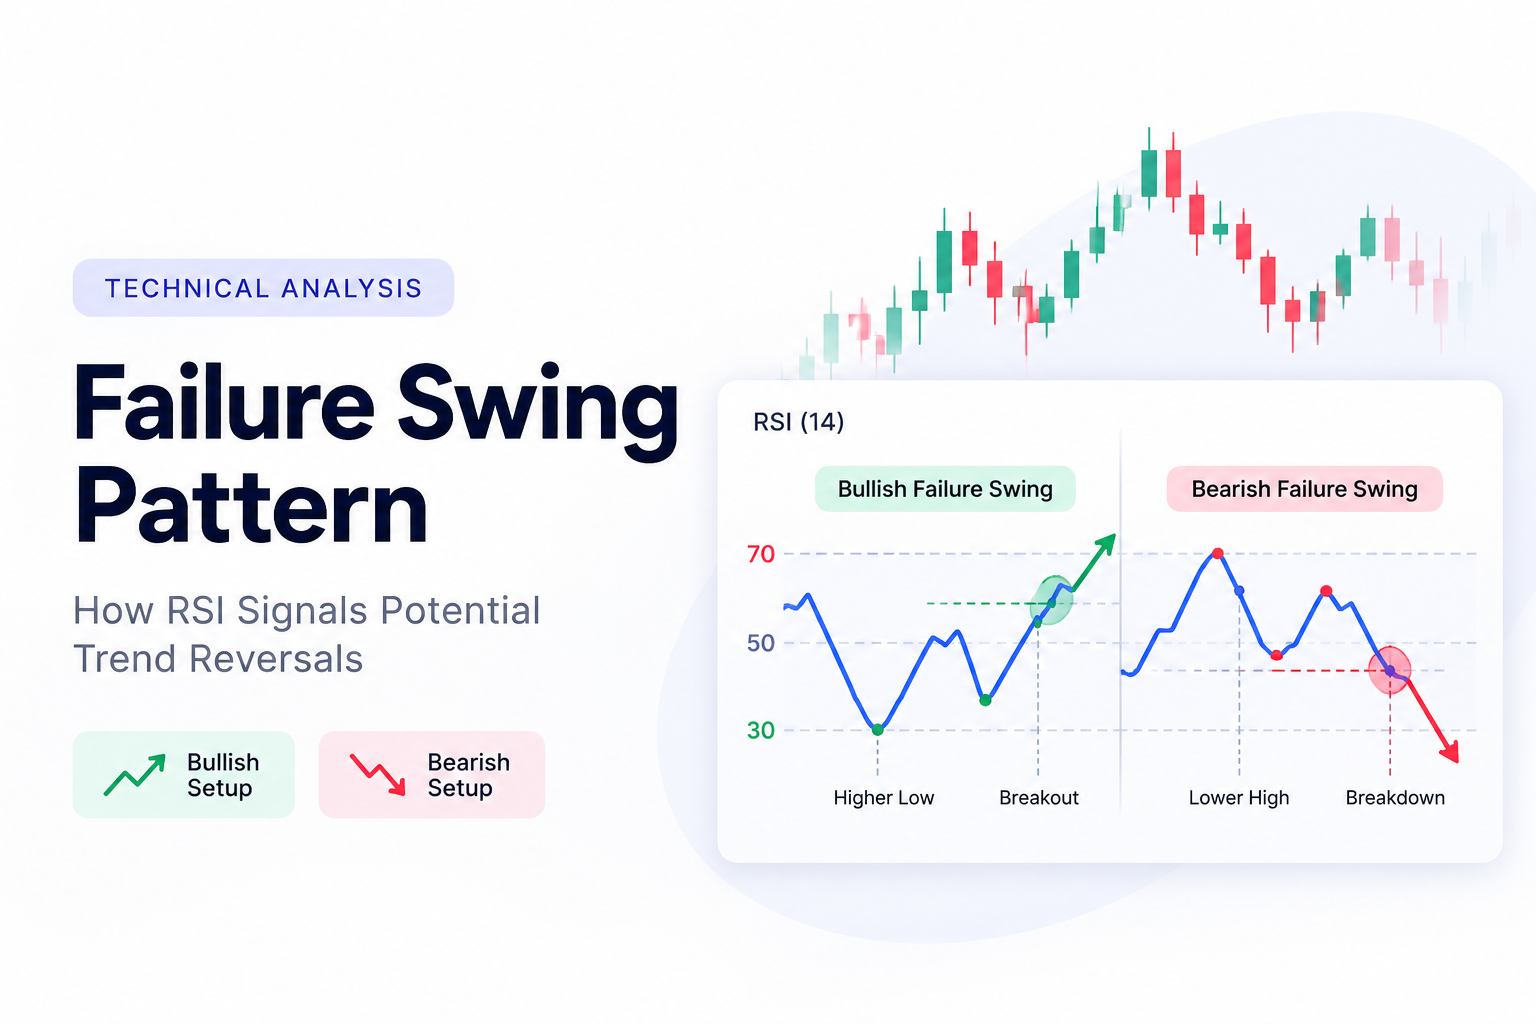
The failure swing pattern is a momentum reversal signal commonly identified using the Relative Strength Index (RSI). It occurs when RSI fails to repeat a previous extreme and then breaks an important swing level, suggesting that the existing trend may be losing momentum.
Traders use bullish and bearish failure swings to identify possible turning points. However, the pattern is best treated as a confirmation signal rather than a standalone reason to enter a trade.
What Is a Failure Swing Pattern?
A failure swing is an RSI pattern that can indicate weakening buying or selling momentum.
The concept is closely associated with RSI creator J. Welles Wilder. Unlike RSI divergence, a failure swing can be identified by looking primarily at the indicator’s own peaks, troughs, and subsequent breakouts.
There are two types:
- Bullish failure swing: Signals that bearish momentum may be weakening.
- Bearish failure swing: Signals that bullish momentum may be weakening.
The important part is not simply whether RSI enters an overbought or oversold region. Traders watch what RSI does after reaching that extreme.
How Does the Failure Swing Pattern Work?
A failure swing develops when RSI reaches an extreme, pulls back, attempts another move in the same direction but fails, and then breaks its previous swing point.
RSI is generally calculated on a scale of 0 to 100. Common reference levels are:
- Above 70: Traditionally considered overbought
- Below 30: Traditionally considered oversold
- Around 50: Often used to assess broader momentum
The 70 and 30 levels are reference points, not automatic sell and buy signals. In a strong trend, RSI can remain overbought or oversold for an extended period.
“Start investing with confidence! Explore
share market
and grow your wealth.”
What Is a Bullish Failure Swing?
A bullish failure swing occurs when RSI shows that downward momentum is weakening. It can suggest a potential shift from selling pressure toward buying momentum.
How to Identify a Bullish Failure Swing
A classic bullish setup develops in four stages:
- RSI falls below 30 into the oversold zone.
- RSI rebounds and forms a swing high.
- RSI declines again but stays above 30, creating a higher low.
- RSI rises and breaks above the previous swing high.
The break above that intermediate RSI high completes the bullish failure swing.
Bullish Failure Swing Example
Suppose RSI falls to 25 before recovering to 42. It then pulls back to 34 rather than dropping below 30 again.
If RSI subsequently rises above 42, the bullish failure swing is confirmed under the classic interpretation.
The sequence looks like this:
25 → 42 → 34 → break above 42
The pattern suggests that sellers were unable to push momentum back to its earlier extreme.
What Is a Bearish Failure Swing?
A bearish failure swing is the opposite setup. It indicates that upward momentum may be weakening and that sellers could be gaining strength.
How to Identify a Bearish Failure Swing
A classic bearish failure swing follows these stages:
- RSI moves above 70 into the overbought zone.
- RSI falls and creates a swing low.
- RSI rebounds but fails to move above 70, forming a lower high.
- RSI falls below the previous swing low.
The break below the intermediate RSI low confirms the bearish failure swing.
Bearish Failure Swing Example
Assume RSI reaches 76 and then falls to 58. It subsequently recovers to 67, failing to return to the overbought zone.
If RSI then breaks below 58, the bearish failure swing is complete.
The sequence is:
76 → 58 → 67 → break below 58
This suggests that buyers failed to reproduce their previous momentum.
Bullish vs Bearish Failure Swing
| Feature | Bullish Failure Swing | Bearish Failure Swing |
|---|---|---|
| Potential signal | Bullish reversal | Bearish reversal |
| Initial RSI condition | Below 30 | Above 70 |
| Second RSI extreme | Higher low, typically above 30 | Lower high, typically below 70 |
| Confirmation | Break above prior RSI swing high | Break below prior RSI swing low |
| Momentum interpretation | Selling pressure is weakening | Buying pressure is weakening |
Both patterns require confirmation. Simply seeing RSI enter an extreme zone does not complete a failure swing.
Failure Swing vs RSI Divergence: What Is the Difference?
Failure swings and RSI divergence are both used to study momentum, but they are not the same signal.
With divergence, traders compare price movement with RSI movement. A bullish divergence, for example, may occur when price makes a lower low while RSI makes a higher low.
A failure swing focuses on the structure created within RSI itself.
| Factor | Failure Swing | RSI Divergence |
|---|---|---|
| Main focus | RSI swing structure | Relationship between price and RSI |
| Price comparison required | Not central to classic pattern | Yes |
| Bullish confirmation | RSI breaks previous swing high | Depends on price and indicator confirmation |
| Bearish confirmation | RSI breaks previous swing low | Depends on price and indicator confirmation |
| Primary purpose | Identify momentum reversal | Identify disagreement between price and momentum |
A chart can sometimes show both signals at once. When that happens, traders may view the combination as additional evidence, but it still does not guarantee a reversal.
How to Trade a Failure Swing Pattern
A practical approach is to wait until the failure swing is complete rather than anticipating the breakout.
1. Add RSI to the Chart
A 14-period RSI is a common starting point. Traders may adjust the period depending on their strategy and timeframe, but changing settings can also change the number and quality of signals.
2. Watch the RSI Extreme
Look for RSI moving below 30 for a potential bullish setup or above 70 for a potential bearish setup.
Do not enter solely because RSI reaches one of these levels.
3. Identify the Second Swing
For a bullish pattern, look for RSI to form a higher low after recovering from oversold conditions.
For a bearish pattern, look for RSI to form a lower high after falling from overbought conditions.
4. Wait for Confirmation
Confirmation occurs when RSI:
- Breaks above its previous swing high in a bullish setup.
- Breaks below its previous swing low in a bearish setup.
Waiting for this move helps distinguish a completed pattern from an RSI fluctuation that only resembles one.
5. Check the Price Chart
Before taking a position, traders can look for confirmation from the underlying price.
Useful factors can include:
- Support and resistance
- Trendlines
- Candlestick patterns
- Breakouts or breakdowns
- Trading volume
- Moving averages
For example, a bullish RSI failure swing occurring near a well-established price support level may provide more context than the same pattern appearing randomly in the middle of a trading range.
6. Define Risk Before Entering
A failure swing can fail, just like any technical pattern.
Traders should determine their entry, invalidation level, stop-loss approach, and potential target before entering a position. Position size should reflect the amount they are prepared to lose if the setup does not work.
Which Timeframe Is Best for Failure Swings?
Failure swings can appear on intraday, daily, and weekly charts. There is no single timeframe that works best in every market.
Shorter timeframes generally contain more market noise and may produce more frequent signals. Higher timeframes can provide broader trend context but generate fewer setups.
A trader might, for example, identify the overall trend on a daily chart and then use a shorter timeframe to look for a failure swing aligned with that trend.
The appropriate timeframe depends on the trading strategy, holding period, liquidity of the instrument, and risk tolerance.
How Can You Reduce False Failure Swing Signals?
Failure swings do not predict every reversal correctly. Strong trends are particularly important to consider because RSI can stay near extreme levels for longer than expected.
Traders can filter potential signals by checking:
- Whether the pattern forms near significant support or resistance
- Whether price confirms the momentum shift
- Whether volume supports the breakout or reversal
- Whether the setup agrees with the higher-timeframe trend
- Whether the risk-to-reward profile makes sense before entry
Adding more indicators does not automatically improve a strategy. A few complementary signals are usually easier to interpret than a chart crowded with indicators measuring similar information.
Advantages of the Failure Swing Pattern
The failure swing pattern has several practical features.
- It provides relatively clear RSI-based confirmation levels.
- It can be used across different markets and timeframes.
- It focuses on changes in momentum rather than relying only on overbought and oversold readings.
- It can complement price action and support-resistance analysis.
- The basic bullish and bearish structures are straightforward to identify once traders understand RSI swings.
Its rule-based structure can also help traders avoid treating every RSI reading above 70 as a sell signal or every reading below 30 as a buy signal.
Limitations of the Failure Swing Pattern
No technical indicator can reliably predict market direction in every situation, and failure swings have several limitations.
False Signals
RSI may complete a failure swing without price producing a meaningful reversal.
Late Entries
Waiting for confirmation means part of the price move may already have occurred before the trader enters.
Strong Trends Can Distort Signals
Overbought does not necessarily mean an asset is about to fall, and oversold does not necessarily mean it will rise. Momentum can remain extreme during powerful trends.
Interpretation Can Vary
Different RSI settings, chart timeframes, and definitions of swing highs and lows can lead traders to identify different setups on the same asset.
For these reasons, backtesting a clearly defined set of rules is more useful than assuming the pattern will work consistently in every market.
Is the Failure Swing Pattern Reliable?
A failure swing can be useful for identifying a potential momentum shift, but its reliability depends on the market, timeframe, RSI settings, and confirmation rules used.
It should not be viewed as a guaranteed reversal pattern.
A more disciplined approach is to define exactly what qualifies as a failure swing, test those rules using historical data, and combine the signal with price structure and risk management.
FAQ About Failure Swing Patterns
Q. What does failure swing mean in RSI?
A failure swing occurs when RSI fails to revisit a previous overbought or oversold extreme and then breaks an intermediate swing level. It can indicate that the existing momentum is weakening.
Q. Is a failure swing bullish or bearish?
It can be either. A bullish failure swing suggests weakening selling momentum, while a bearish failure swing suggests weakening buying momentum.
Q. What confirms a bullish failure swing?
A bullish failure swing is confirmed when RSI breaks above the swing high formed after its initial move into the oversold region.
Q. What confirms a bearish failure swing?
A bearish failure swing is confirmed when RSI breaks below the swing low formed after its initial move into the overbought region.
Q. Is a failure swing the same as RSI divergence?
No. RSI divergence compares price action with RSI. A classic failure swing focuses on the sequence of highs and lows within RSI itself.
Q. Can beginners use the failure swing pattern?
Yes, the basic structure is relatively simple to understand. Beginners should still learn how RSI works, practise identifying completed patterns, and understand risk management before using the signal for real trades.
Q. Which RSI setting is commonly used for failure swings?
The 14-period RSI is a common starting point because it is the traditional RSI setting. Traders may test other periods depending on the asset and timeframe.
Key Takeaways
- A failure swing pattern is an RSI-based signal used to identify possible momentum reversals.
- Bullish failure swings can indicate weakening selling pressure.
- Bearish failure swings can indicate weakening buying pressure.
- The RSI breakout of the previous swing level is an important confirmation step.
- Failure swings and RSI divergence are related momentum concepts, but they are not the same pattern.
- Support, resistance, price action, volume, and trend context can help traders evaluate a setup.
- Failure swings can produce false signals, so risk management and testing remain essential.
Disclaimer
The stocks mentioned in this article are not recommendations. Please conduct your own research and due diligence before investing. Investment in securities market are subject to market risks, read all the related documents carefully before investing. Please read the Risk Disclosure documents carefully before investing in Equity Shares, Derivatives, Mutual fund, and/or other instruments traded on the Stock Exchanges. As investments are subject to market risks and price fluctuation risk, there is no assurance or guarantee that the investment objectives shall be achieved. Lemonn (Formerly known as NU Investors Technologies Pvt. Ltd) do not guarantee any assured returns on any investments. Past performance of securities/instruments is not indicative of their future performance.
Related Posts



Download Lemonn
Download my trading app for SIP, demat account services—get a free demat account with our demat apps.



