
Stock Market Heatmap India: Beginner’s Guide to Reading It
If you’ve ever opened a stock market heatmap and felt overwhelmed by a screen full of green and red boxes, you’re not alone.
Many beginner traders see a stock heatmap for the first time and wonder what all those colors, sizes, and sectors actually mean.
The good news is that stock heatmaps are one of the easiest tools to learn.
A stock heatmap India helps traders quickly understand what’s happening across the market without analyzing hundreds of individual stocks. In just a few seconds, you can see which sectors are strong, which stocks are falling, and where market momentum is building.
In this beginner’s guide, you’ll learn how stock heatmaps work, how to interpret colors and block sizes, and how to use them to make smarter trading decisions.
What Is a Stock Market Heatmap?
A stock market heatmap is a visual tool that displays stock performance using colored blocks.
Each block represents a company listed on the stock exchange.
The heatmap uses:
- Colors to show price movement
- Block sizes to show company size
- Sector grouping to organize stocks
Instead of reading long stock lists, traders can understand market activity instantly.
Think of a stock heatmap as a map of the market.
Just as a weather map shows temperatures across regions, a heatmap shows stock performance across sectors and companies.
Why Do Traders Use Stock Heatmaps?
The Indian stock market contains thousands of listed companies.
Reviewing every stock individually is impossible.
A heatmap simplifies this process by answering important questions quickly:
- Is the market bullish or bearish today?
- Which sectors are performing best?
- Which stocks are leading the market?
- Where is investor interest increasing?
- Which sectors should I avoid?
Heatmaps save time and help traders focus on the stocks that matter most.
“Start investing with confidence! Explore
Lemonn
and grow your wealth.”
What Information Does a Stock Heatmap Show?
Most stock heatmaps display three main types of information.
Price Performance
The primary purpose of a heatmap is to show how stocks are performing.
You can instantly identify:
- Gainers
- Losers
- Strong performers
- Weak performers
Sector Classification
Stocks are usually grouped by sector.
Examples include:
- Banking
- Information Technology
- Auto
- FMCG
- Pharma
- Energy
- Metals
This helps traders identify sector-wide trends.
Market Capitalization
The size of each block usually reflects the company’s market value.
Larger companies appear as larger blocks.
This allows traders to understand which stocks have the greatest influence on market indices.
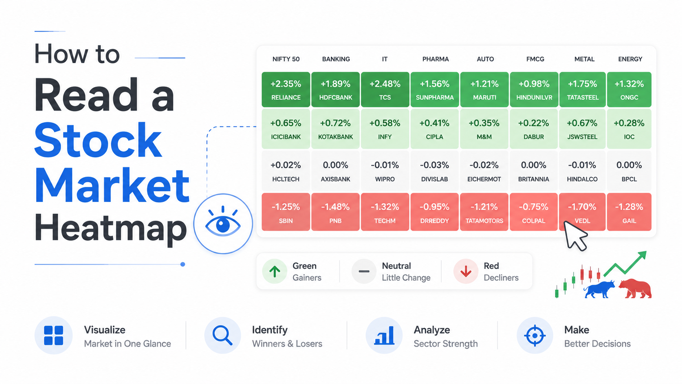
How to Read Stock Heatmap Colors
Colors are the easiest part of a heatmap to understand.
Green Means the Stock Is Rising
When a stock is trading above its previous closing price, it typically appears in green.
Different shades often indicate different levels of performance.
Light Green
Small gains.
Example:
+0.5%
Medium Green
Moderate gains.
Example:
+1% to +2%
Dark Green
Strong gains.
Example:
+3% or higher
The darker the green, the stronger the stock’s performance.
Red Means the Stock Is Falling
Red indicates a stock is trading below its previous closing price.
Light Red
Small decline.
Example:
-0.5%
Medium Red
Moderate decline.
Example:
-1% to -2%
Dark Red
Strong decline.
Example:
-3% or more
Dark red areas often indicate significant selling pressure.
Grey or Neutral Colors
Some heatmaps use grey shades for stocks showing little movement.
These stocks are generally having minimal impact on market direction.
Understanding Block Sizes
Many beginners assume every stock should appear the same size.
In reality, larger companies receive larger blocks.
Why Are Some Blocks Bigger?
Heatmaps often use market capitalization weighting.
That means larger companies receive larger visual representation.
Example
| Company | Typical Heatmap Size |
|---|---|
| Reliance Industries | Very Large |
| HDFC Bank | Very Large |
| Infosys | Large |
| Tata Consultancy Services | Large |
| Small-Cap Stock | Small |
This helps traders see which companies influence the market most.
How Sectors Are Organized
One of the most useful features of a stock heatmap is sector grouping.
Instead of displaying stocks randomly, heatmaps organize companies into categories.
Banking Sector
May include:
- HDFC Bank
- ICICI Bank
- SBI
- Axis Bank
If most banking stocks are green, the sector is likely strong.
Information Technology Sector
May include:
- Infosys
- TCS
- Wipro
- HCLTech
A cluster of green stocks suggests positive sentiment toward the IT sector.
Auto Sector
May include:
- Tata Motors
- Maruti Suzuki
- Mahindra & Mahindra
Strong movement across the group may indicate sector-wide momentum.
How to Read a Stock Heatmap in 5 Minutes
If you’re new to trading, follow this simple process.
Step 1: Check Overall Market Sentiment
Look at the overall balance between:
- Green blocks
- Red blocks
More green generally indicates bullish sentiment.
More red may suggest weakness.
Step 2: Find the Strongest Sector
Identify sectors showing the highest concentration of green stocks.
Strong sectors often produce the best trading opportunities.
Step 3: Identify the Top Performing Stocks
Within strong sectors, look for stocks outperforming their peers.
These often attract trader attention.
Step 4: Check Volume
Before taking a trade, confirm that the move is supported by strong trading volume.
High volume often indicates genuine market interest.
Step 5: Review the Stock Chart
Heatmaps help you discover opportunities.
Charts help you decide whether to trade them.
Always analyze:
- Trend direction
- Support levels
- Resistance levels
- Risk-reward ratio
before entering a position.
3 Practical Ways to Use a Heatmap for Better Trades
1. Identify Strong Sectors Before Trading
Professional traders often start with sectors before stocks.
If banking stocks are leading the market, traders may focus their attention there first.
This improves efficiency and increases the chances of finding momentum trades.
2. Spot Outlier Stocks
Sometimes a stock performs strongly even when its sector is weak.
Example:
- Most IT stocks are red
- One IT stock is dark green
This relative strength may indicate unusual buying activity.
Such stocks often deserve further analysis.
3. Confirm Trading Ideas
Suppose you’ve already identified a stock on your watchlist.
The heatmap can help answer:
- Is the sector strong?
- Are peers moving higher?
- Is market sentiment supportive?
This additional confirmation can improve confidence.
Where Can You Access a Stock Heatmap in India?
Many trading platforms offer heatmap tools.
However, traders should look for features such as:
- Real-time updates
- Sector filters
- Easy navigation
- Broad market coverage
- Mobile accessibility
Lemonn’s Stock Heatmap helps traders visualize market activity quickly and identify opportunities without manually scanning hundreds of stocks.
Benefits of Using Lemonn’s Heatmap
- Live market updates
- Sector-wise organization
- Easy-to-read color coding
- Nifty and broader market coverage
- Beginner-friendly interface
Whether you’re a new investor or an active trader, a heatmap can significantly simplify market analysis.
Heatmap vs Stock Chart: What’s the Difference?
Many beginners confuse heatmaps with charts.
They serve different purposes.
| Feature | Heatmap | Stock Chart |
|---|---|---|
| Purpose | Market overview | Individual stock analysis |
| Scope | Entire market | Single stock |
| Speed | Fast overview | Detailed analysis |
| Best For | Finding opportunities | Executing trades |
Most traders use both tools together.
The heatmap finds opportunities.
The chart confirms them.
Common Mistakes Beginners Make
Looking Only at Colors
Green doesn’t automatically mean “buy.”
Always review the stock chart first.
Ignoring Sector Trends
A strong stock in a weak sector may struggle to sustain momentum.
Sector strength matters.
Chasing Big Moves
Stocks that have already moved sharply may carry higher risk.
Consider risk-reward before entering.
Skipping Volume Analysis
Volume helps confirm whether a move is supported by real buying or selling activity.
Key Takeaways
- A stock heatmap India helps traders understand market performance visually.
- Green indicates gains while red indicates declines.
- Larger blocks represent larger companies.
- Sector grouping helps identify market leadership.
- Heatmaps simplify market analysis and save time.
- Traders use heatmaps to discover opportunities before analyzing charts.
- Combining heatmaps with volume and chart analysis improves decision-making.
Frequently Asked Questions
Q. What does a red block on a stock heatmap mean?
A red block generally indicates that the stock is trading below its previous closing price.
Q. Which is the best free stock heatmap for the Indian market?
The best heatmaps provide real-time data, sector filters, clear visualizations, and easy navigation for traders.
Q. Can beginners use a stock heatmap?
Yes. Heatmaps are one of the simplest market analysis tools available and are ideal for beginners.
Q. Do professional traders use heatmaps?
Yes. Many professional traders use heatmaps to monitor market sentiment, sector strength, and stock performance.
Q. Can I use a heatmap for long-term investing?
Absolutely. Investors can use heatmaps to monitor sector trends, market leadership, and relative stock performance over time.
Conclusion
A stock heatmap is one of the easiest ways to understand what’s happening in the market at a glance. Instead of scanning hundreds of stocks individually, you can instantly identify strong sectors, leading stocks, and overall market sentiment.
For beginners, learning to read a stock heatmap India can dramatically simplify market analysis and improve decision-making. By understanding colors, block sizes, sector groupings, and volume confirmation, you’ll be able to find opportunities faster and approach trading with greater confidence.
Start exploring Lemonn’s stock heatmap today and turn complex market data into simple visual insights.
Disclaimer
The stocks mentioned in this article are not recommendations. Please conduct your own research and due diligence before investing. Investment in securities market are subject to market risks, read all the related documents carefully before investing. Please read the Risk Disclosure documents carefully before investing in Equity Shares, Derivatives, Mutual fund, and/or other instruments traded on the Stock Exchanges. As investments are subject to market risks and price fluctuation risk, there is no assurance or guarantee that the investment objectives shall be achieved. Lemonn do not guarantee any assured returns on any investments. Past performance of securities/instruments is not indicative of their future performance.
To read the RA disclaimer
Research Analyst - Gaurav Garg
Related Posts


Download Lemonn
Download my share market app for stock trading—trade stocks effortlessly in the market.


