
Best Technical Indicators for Day Trading in India 2026: What Actually Works
The Indicator Overload Problem
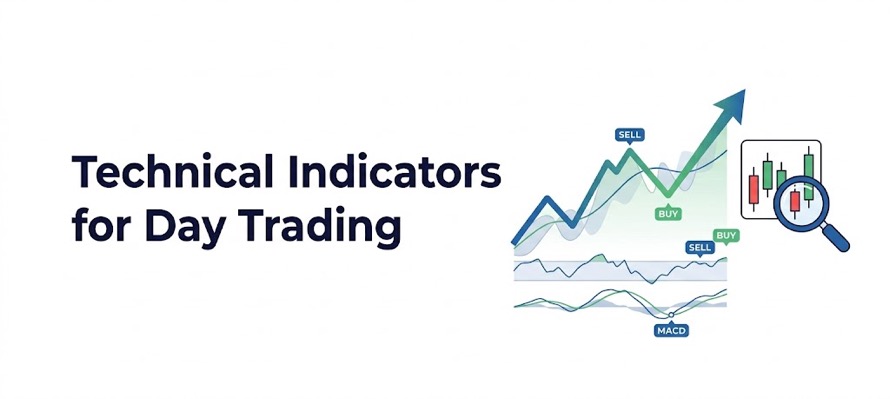
Most retail traders fail not from too few indicators, but too many. Covering your chart with 8 indicators creates analysis paralysis and contradictory signals. Professional traders typically use 2–3 complementary indicators. Here we examine which ones consistently add value for Indian intraday traders.
The 5 Most Effective Indicators for Indian Day Trading
“Start investing with confidence! Explore
share market
and grow your wealth.”
1. VWAP (Volume Weighted Average Price)
VWAP is the gold standard for intraday trading. It resets daily and shows the average price weighted by volume. Institutions use VWAP as execution benchmark; they buy below VWAP and sell above. Price above VWAP = bullish intraday bias. Price below VWAP = bearish intraday bias. The best setups are VWAP bounces after opening noise settles (typically after 9:45 AM IST).
2. 9 EMA and 21 EMA Crossover
On 5-minute charts, when 9 EMA crosses above 21 EMA, it signals intraday upward momentum. Below means bearish. Use this on Nifty or Bank Nifty futures chart combined with VWAP for high-quality setups.
3. Supertrend
Supertrend (7, 3 setting) plots a line above or below price. When price is above Supertrend (green line), the trend is up. When below (red line), trend is down. Simple, visual, and effective for trend-following in liquid stocks.
4. RSI (14) on 15-Minute Chart
For swing entries during the day, RSI on 15-minute charts identifies momentum turning points. Entering when RSI crosses 50 from below (in an intraday uptrend) gives defined risk entries with momentum confirmation.
5. Volume (Relative to Average)
Volume is not technically an indicator but the most important data overlay. Any signal: breakout, reversal, trend continuation is more reliable when accompanied by volume 1.5x–2x the 20-day average. Chart platforms show volume bars below the price chart.
Indicator Combination That Works
| Signal | Confirmation Needed | Entry Quality |
|---|---|---|
| Price above VWAP | + 9/21 EMA bullish cross | High |
| Supertrend turns green | + Volume surge at signal candle | High |
| RSI crosses 50 (15 min) | + Price above VWAP + Supertrend green | Highest |
| Breakout from range | + Volume 2x average + RSI > 50 | High |
| Single indicator signal only | No confluence | Low; avoid |
Platform Settings for Lemonn Users
Lemonn’s trading platform allows custom indicator configuration. Recommended settings:
- VWAP: Standard (available in all chart platforms)
- EMA: Period 9, Period 21 on 5-minute candles
- Supertrend: ATR Period 7, Multiplier 3
- RSI: Period 14, Overbought 70, Oversold 30
- Volume: 20-period average overlay
Disclaimer
The stocks mentioned in this article are not recommendations. Please conduct your own research and due diligence before investing. Investment in securities market are subject to market risks, read all the related documents carefully before investing. Please read the Risk Disclosure documents carefully before investing in Equity Shares, Derivatives, Mutual fund, and/or other instruments traded on the Stock Exchanges. As investments are subject to market risks and price fluctuation risk, there is no assurance or guarantee that the investment objectives shall be achieved. Lemonn (Formerly known as NU Investors Technologies Pvt. Ltd) do not guarantee any assured returns on any investments. Past performance of securities/instruments is not indicative of their future performance.
Related Posts



Download Lemonn
Download my trading app for SIP, demat account services—get a free demat account with our demat apps.



