
Understanding Rolling Returns vs Point-to-Point Returns
Introduction
Open any mutual fund factsheet, and investor eyes go straight to one number. Three-year return. Five-year CAGR. Since-inception growth. It looks decisive. It feels authoritative. Capital flows toward it.
Yet that number depends entirely on where the clock started and where it stopped.
A single entry and exit date captures only one slice of that motion. Change the starting point by a few months, and the outcome can look dramatically different.
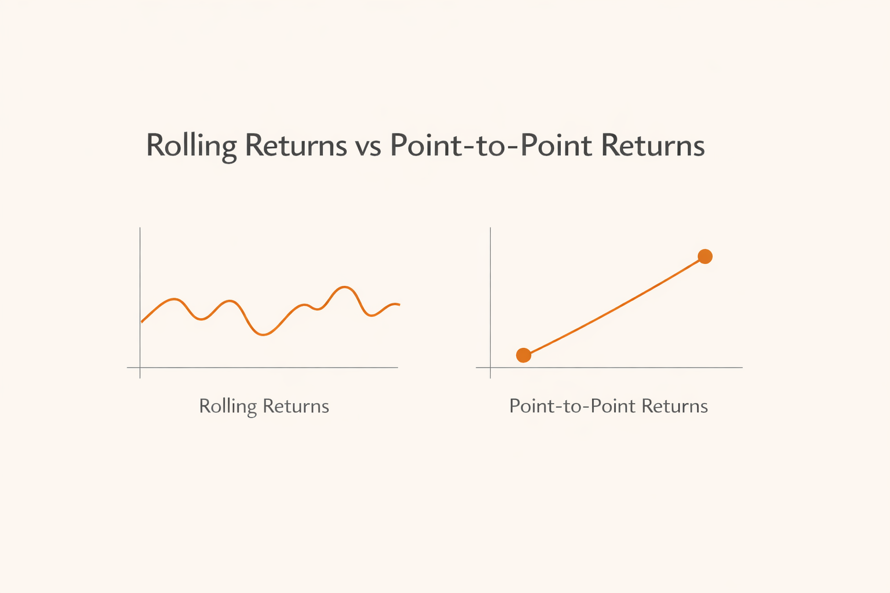
This is where the debate around Rolling Returns vs Point-to-Point Returns becomes essential. Both metrics measure performance. Both rely on historical NAV data. Both appear mathematically sound. But they answer different questions and lead to different conclusions.
Point-to-point returns describe what happened over a specific period. Rolling returns evaluate performance across multiple overlapping periods, offering insight into consistency and probability. One is a snapshot. The other is a behavioral study of returns over time.
What are point-to-point (trailing) returns?
Point-to-point returns, also known as trailing returns, are the returns that are measured between two specific dates. Let’s say a fund is showing a 5-year CAGR of 14% as of Feb 2026. This means investors who invested in the fund in Feb 2021 have earned 14% returns on their investment annually.
This method uses CAGR because it smooths growth across years. Moreover, it converts total return into an annualized figure. CAGR assumes compounding. It assumes continuity. It compresses volatility into a single clean percentage.
That clarity explains why trailing returns dominate marketing material. They are easy to communicate. They look precise. They support quick comparisons.
But trailing returns are extremely sensitive to timing.
Imagine a fund measured from the bottom of a bear market. The subsequent five-year return may look extraordinary. Now imagine measuring that same fund from the peak of a bull market. The five-year number may look average.
Nothing about the fund changed. Only the start date did.
Trailing returns answer one narrow question: “What did an investor earn if they invested on this exact date and exited on this exact date?” They do not answer whether the performance was consistent across cycles. They do not reveal the range of outcomes experienced by investors entering at different times.
They are precise. They are limited. They tell one side of the story.
“Start investing with confidence! Explore
0 demat account
and grow your wealth.”
What are rolling returns, and how are they calculated?
Rolling returns eliminate single-date bias by calculating returns across multiple overlapping periods within a broader time frame. Instead of relying on one fixed entry point, rolling analysis evaluates many possible entry points.
Consider five-year rolling returns over the last fifteen years. The calculation proceeds systematically:
First, calculate the return from Year 1 to Year 6.
Next, calculate the return from Year 2 to Year 7.
Then, Year 3 to Year 8.
Continue forward until the most recent five-year block is completed.
Each five-year window produces its own CAGR. The result is not one number, but a series of five-year outcomes.
This method allows investors to analyze:
- The best five-year return delivered
- The worst five-year return delivered
- The average rolling return across all periods
- The frequency of outperformance against a benchmark
Rolling returns shift analysis from a single observation to a distribution of outcomes. They reveal how the fund behaved across different market conditions, entry points, and economic cycles.
That difference changes the interpretation entirely. Instead of asking what happened during one selected period, the question becomes: how did the fund behave across time?
A simple example (what the numbers mean)
Let us compare two hypothetical funds: Fund Alpha and Fund Beta.
Over the past five years, Alpha has shown a trailing return of 18 percent. Beta shows 16 percent. On paper, Alpha appears superior.
Now examine five-year rolling returns over the past fifteen years.
| Metric | Fund Alpha | Fund Beta |
|---|---|---|
| Best 5-Year Return | 25% | 20% |
| Worst 5-Year Return | 3% | 10% |
| Average Rolling Return | 14% | 15% |
| % of Periods Beating Benchmark | 48% | 82% |
The picture changes immediately.
Alpha produces spectacular peaks. It also produces deep troughs. Beta delivers steadier performance across cycles.
An investor entering Alpha during an unfavorable window might experience modest returns despite the strong trailing figure. Beta’s consistency offers narrower variability and more dependable outcomes.
This example illustrates a central truth: trailing returns can exaggerate recent momentum. Rolling returns expose variability, risk, and repeatability.
Why rolling returns are usually a better judge
Rolling returns provide a deeper lens for three major reasons:
- Consistency Assessment: They reveal how often a fund outperformed its benchmark across time, rather than during a single period.
- Downside Visibility: They highlight the worst historical periods, offering insight into potential drawdown risk.
- Skill Validation: They help distinguish structural management capability from temporary market momentum.
Professional analysts emphasize rolling returns because they examine behavior across cycles. They capture expansion phases, corrections, stagnation periods, and recoveries. They evaluate resilience under stress. They reveal durability.
Trailing returns inform. Rolling returns validate.
Limitations & practical caveats
Rolling returns offer depth, but they are not flawless.
First, they require long historical data. A new fund with a short track record cannot produce meaningful rolling analysis for extended horizons.
Second, rolling results depend on the chosen time frames. Three-year rolling returns may produce different insights than seven-year rolling returns. Horizon alignment remains critical.
Third, rolling analysis is historical. Shifts in strategy, fund management, or macroeconomic conditions can alter future patterns.
Fourth, rolling data may appear overwhelming to inexperienced investors. Multiple numbers require interpretation. Without context, variability can confuse rather than clarify.
Finally, rolling returns assume disciplined holding across the full time window. Behavioral exits driven by emotion can produce experiences different from theoretical rolling outcomes.
Rolling analysis strengthens evaluation. It does not eliminate uncertainty.
How to use rolling returns when selecting mutual funds – a practical checklist
Applying rolling returns effectively requires discipline. A structured checklist prevents misinterpretation and ensures alignment with investment objectives.
- Match the rolling period to your investment horizon. A five-year goal requires a five-year rolling analysis.
- Examine the frequency of benchmark outperformance. Consistency matters more than occasional spikes.
- Identify the lowest rolling return delivered. That number defines historical downside exposure.
- Compare rolling averages against peer funds within the same category.
- Combine rolling returns with volatility metrics such as standard deviation and Sharpe ratio.
- Observe how rolling returns behaved during market stress periods, not only during rallies.
This checklist transforms analysis into a systematic process. Decisions become rooted in evidence rather than recent performance headlines.
Example use cases (when rolling returns changed the decision)
In a large-cap comparison, Fund A showed a five-year trailing return of 19 percent. Fund B showed 16 percent. Initial analysis favored Fund A. Rolling data revealed that Fund B outperformed its benchmark in 85 percent of rolling periods, while Fund A outperformed in less than half. The allocation shifted.
In a mid-cap allocation decision, a fund’s trailing return surged after a strong rally. Rolling analysis revealed historical five-year windows with compressed returns during tightening cycles. Exposure was moderated accordingly.
In a retirement portfolio review, two balanced funds displayed similar trailing returns. Rolling returns showed one fund consistently delivered returns within a narrow 8 to 11 percent band, while the other fluctuated widely. Stability aligned better with retirement income needs.
Each case demonstrates the same principle. Rolling returns alter perspective. They expose patterns invisible in trailing numbers.
Tools & where to find rolling returns
Rolling return data is widely accessible across financial research platforms, mutual fund analytics portals, and advisory tools. Many websites provide interactive rolling charts that compare funds against benchmarks and peer categories.
Investors comfortable with spreadsheets can download historical NAV data and compute rolling CAGRs using financial formulas. Modern portfolio software simplifies this process further.
When reviewing rolling charts, focus on consistency bands, frequency of outperformance, and variability range. Is performance clustered tightly around an average, or widely dispersed? That distinction matters.
Data access is easy. Interpretation remains the real skill.
Bottom line – When to rely on which metric
Point-to-point returns serve a defined purpose. They evaluate performance over a specific time interval and help investors understand realized growth during a chosen holding period. They remain useful for reporting and short-term comparison.
Rolling returns serve a broader analytical function. They assess sustainability, reveal volatility patterns, and measure consistency across cycles. They provide probability-based insight into historical behavior.
Conclusion
Performance measurement shapes capital allocation. A single trailing figure can influence decisions quickly, yet it captures only one historical journey. Rolling returns widen the lens and evaluate performance across multiple starting points and market conditions.
Understanding Rolling Returns vs Point-to-Point Returns elevates fund analysis from superficial comparison to structured evaluation. One metric answers what happened over a fixed interval. The other reveals how performance behaved across time.
FAQs:
Q. What is point to point return?
Point to point return measures the absolute return between a specific start date and end date.
Q. What does “rolling return” mean?
Rolling return calculates returns across multiple overlapping periods to show consistency over time.
Q. Are rolling returns better than average returns?
Rolling returns provide deeper insight into performance stability compared to simple average returns.
Disclaimer
The stocks mentioned in this article are not recommendations. Please conduct your own research and due diligence before investing. Investment in securities market are subject to market risks, read all the related documents carefully before investing. Please read the Risk Disclosure documents carefully before investing in Equity Shares, Derivatives, Mutual fund, and/or other instruments traded on the Stock Exchanges. As investments are subject to market risks and price fluctuation risk, there is no assurance or guarantee that the investment objectives shall be achieved. Lemonn (Formerly known as NU Investors Technologies Pvt. Ltd) do not guarantee any assured returns on any investments. Past performance of securities/instruments is not indicative of their future performance.
Related Posts


Download Lemonn
Download my app for share market trading, ipo investment, trading account, and all your investment needs.


