India’s Top States by GST Collections in FY26
 Written by Supratim Choudhury
 Reviewed by Gaurav Garg, SEBI-registered Research Analyst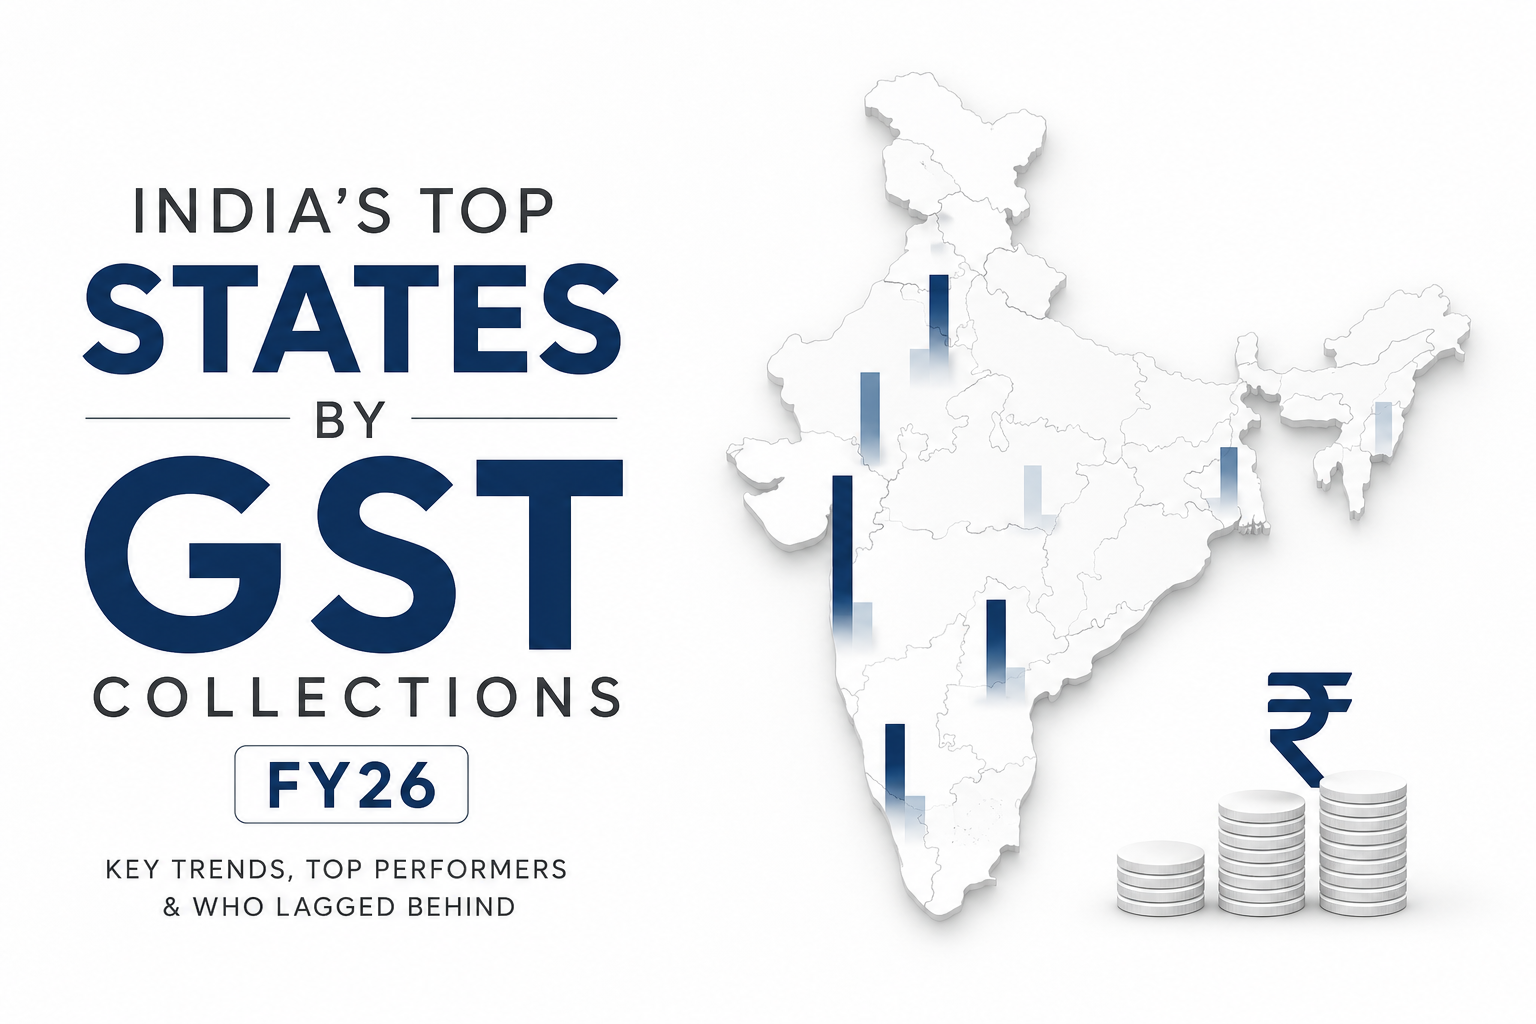
India’s gross Goods and Services Tax (GST) collections crossed ₹22.27 lakh crore in the financial year (FY) 2025-26, up 8.3% from the previous financial year. Among states, Maharashtra ranked first with about ₹3.62 lakh crore, followed by Karnataka, Gujarat, Tamil Nadu, and Haryana.
The numbers also reveal a wide gap between India’s biggest GST-collecting states and smaller states and Union Territories (UTs). But GST data comes with an important complication: the national total, the state-wise ranking, and the revenue that finally accrues to a state government are three different measures.
Here is a closer look at the FY26 rankings, the states showing strong growth, and what these figures actually tell us about their economies.
First, what do the three GST numbers in this article mean?
You do not need to understand the mechanics of GST settlement to read the rankings. Just keep these three measures separate:
| Measure | What it tells you | How this article uses it |
| India’s gross GST collection | Total GST collected nationally from domestic transactions and imports | Used for the ₹22.27 lakh crore national figure |
| State-wise GST collection | GST collected on domestic transactions and recorded against each state or UT | Used to rank Maharashtra, Karnataka, Gujarat, and other states |
| Post-settlement SGST | Revenue available to a state after its State GST and the relevant share of interstate GST are taken into account | Used only when comparing state revenue growth |
The simplest way to read the article is as follows: the state-wise GST figure tells us where taxable domestic activity is being recorded, while post-settlement SGST tells us more about the GST revenue ultimately accruing to a state after interstate tax is shared.
They answer different questions, so they should not be compared directly.
How much GST did India collect in FY26?
India recorded ₹22,27,096 crore, or about ₹22.27 lakh crore, in gross GST collections in FY26, representing year-on-year growth of 8.3%. Net GST revenue after refunds stood at ₹19,34,766 crore, or about ₹19.35 lakh crore, up 7.1% from the previous financial year.
There is one important distinction. The ₹22.27 lakh crore national figure includes GST collected on imports. The state ranking below does not. It uses the government’s state-wise table of GST collected from domestic transactions. That domestic total was about ₹16.32 lakh crore in FY26, while gross GST collected on imports was about ₹5.95 lakh crore.
“Start investing with confidence! Explore
0 demat account
and grow your wealth.”
Which states collected the most GST in FY26?
Maharashtra had the highest GST collection in the government’s state-wise domestic table, at about ₹3.62 lakh crore. Karnataka ranked a distant second at about ₹1.58 lakh crore.
Top 10 states by GST collections in FY26
| Rank | State | FY26 state-wise GST collection |
| 1 | Maharashtra | ₹3,61,778 crore |
| 2 | Karnataka | ₹1,58,217 crore |
| 3 | Gujarat | ₹1,35,415 crore |
| 4 | Tamil Nadu | ₹1,30,248 crore |
| 5 | Haryana | ₹1,21,080 crore |
| 6 | Uttar Pradesh | ₹99,917 crore |
| 7 | Delhi | ₹80,425 crore |
| 8 | West Bengal | ₹65,230 crore |
| 9 | Telangana | ₹60,840 crore |
| 10 | Rajasthan | ₹53,881 crore |
Source: GST Portal, “GST Gross and Net Collections as on 31/03/2026”, Table 3. Figures are provisional and rounded to the nearest crore.
These figures cover GST recorded for each state or UT on domestic activity. The table includes Central Goods and Services Tax (CGST), State Goods and Services Tax (SGST), and Integrated Goods and Services Tax (IGST) collected on domestic transactions. It excludes GST collected on imports.
The important point is that this is the table to use when asking which states recorded the most GST collections during FY26.
The ranking is dominated by states with large formal economies, major consumption centres, and significant industrial or services activity. It should not, however, be treated as a direct ranking of state economies. GST is a destination-based tax, and interstate transactions and place-of-supply rules influence where tax is recorded.
1. Maharashtra: ₹3.62 lakh crore
Maharashtra topped the FY26 state-wise GST ranking with about ₹3.62 lakh crore. Its lead was substantial. Maharashtra collected roughly 2.3 times as much as Karnataka, which ranked second.
The state has one of India’s largest and most diversified economies. Mumbai is a major centre for finance, professional services, entertainment, and consumption, while Pune and other industrial regions contribute substantial manufacturing, technology, and commercial activities. That broad economic base is consistent with Maharashtra’s position at the top of the GST table.
However, the presence of a company headquarters in Mumbai does not mean all GST connected with that company goes to Maharashtra. GST is a destination-based tax. So, the location of the customer or final consumption influences where the tax is attributed.
2. Karnataka: ₹1.58 lakh crore
Karnataka ranked second with about ₹1.58 lakh crore in state-wise GST collections during FY26. Bengaluru is a major technology and services hub, while Karnataka also has sizeable electronics, aerospace, biotechnology, automotive, and manufacturing industries. Its ranking is consistent with the scale of formal business and services activity in the state.
Even so, Karnataka’s collections were less than half of Maharashtra’s, highlighting the size of Maharashtra’s lead.
3. Gujarat: ₹1.35 lakh crore
Gujarat ranked third, recording about ₹1.35 lakh crore in FY26 state-wise GST collections. The state has a strong manufacturing base across chemicals, pharmaceuticals, engineering, automobiles, textiles, and other industries. Gujarat is also a major trade and logistics hub.
There is an important caveat when connecting this activity with GST collections. Exports are zero-rated under GST, so a state’s export strength does not translate directly into higher domestic GST revenue.
4. Tamil Nadu: ₹1.30 lakh crore
Tamil Nadu ranked fourth with about ₹1.30 lakh crore in FY26 GST collections. The state has a diversified manufacturing economy, with significant activity in automobiles, auto components, electronics, textiles, and engineering. Chennai also has a large technology and services sector.
Tamil Nadu finished relatively close to Gujarat, with a difference of about ₹5,167 crore between their FY26 collections.
5. Haryana: ₹1.21 lakh crore
Haryana completed the top five with about ₹1.21 lakh crore in state-wise GST collections. Its ranking stands out because Haryana has a considerably smaller population than several states below it. Gurugram is an important corporate and services centre, while the state also has major automobile, manufacturing, and industrial clusters.
Haryana also performed strongly on a different GST measure in FY26. Its post-settlement SGST revenue grew 22%, the highest growth among states. That 22% figure does not mean Haryana’s ₹1.21 lakh crore GST collection grew by 22%. The two numbers come from different datasets.
Think of them this way:
- ₹1.21 lakh crore: GST recorded for Haryana in the state-wise collection table.
- 22% growth: Growth in GST revenue available to Haryana after interstate GST settlements were accounted for.
Keeping those two measures separate avoids one of the biggest sources of confusion in state GST comparisons.
What about Uttar Pradesh, Delhi, and other large economies?
Uttar Pradesh narrowly missed the top five, ranking sixth with about ₹99,917 crore in state-wise GST collections. Delhi followed at ₹80,425 crore. West Bengal ranked eighth at about ₹65,230 crore, Telangana ninth at ₹60,840 crore, and Rajasthan completed the top 10 at ₹53,881 crore.
One intriguing result is Uttar Pradesh’s position. Despite being India’s most populous state, it collected substantially less GST than Maharashtra and also trailed Karnataka, Gujarat, Tamil Nadu, and Haryana.
This is a useful reminder that population alone does not determine GST collections. Formalisation, consumption levels, the value of taxable transactions, sector mix, and business activity can all influence how much GST is recorded for a state.
Which states and UTs collected the least GST in FY26?
At the other end of the ranking were some of India’s smallest states and UTs.
Lowest GST collectors in FY26
| State or UT | FY26 state-wise GST collection |
| Lakshadweep | ₹25 crore |
| Mizoram | ₹450 crore |
| Ladakh | ₹539 crore |
| Andaman and Nicobar Islands | ₹572 crore |
| Manipur | ₹746 crore |
Lakshadweep recorded the lowest collection at about ₹25 crore. Mizoram was next at ₹450 crore, followed by Ladakh at ₹539 crore.
These figures require context. Smaller absolute GST collections do not automatically indicate weak tax compliance or poor economic performance. Population, consumption, economic size, geography, and the scale of formal business activity differ enormously between these regions and states such as Maharashtra or Karnataka.
For that reason, comparing Maharashtra’s ₹3.62 lakh crore directly with Lakshadweep’s ₹25 crore tells us more about differences in economic scale and taxable activity than about which administration is performing better.
Which state recorded the strongest GST revenue growth in FY26?
This section uses post-settlement SGST, not the state-wise collection ranking used above.
SGST is the state portion of the GST collected on eligible transactions within a state. For interstate transactions, IGST is generally collected first and then divided between the Centre and the destination state through the GST settlement process. Therefore, post-settlement SGST provides a better view of the GST revenue accruing to a state after that sharing process.
Haryana recorded the highest cumulative post-settlement SGST growth among states in FY26, at 22%. Maharashtra remained the largest state in absolute post-settlement SGST terms, with about ₹1.96 lakh crore, up 13%.
Post-settlement SGST revenue and growth in major states:
- Haryana recorded ₹48,289 crore, up 22%.
- Maharashtra recorded ₹1.96 lakh crore, up 13%.
- Gujarat recorded ₹80,823 crore, up 10%.
- Karnataka recorded ₹87,256 crore, up 5%.
- Tamil Nadu recorded ₹78,117 crore, up 3%.
These figures provide a different perspective from the main state ranking. A state can have very high GST collections but relatively modest growth in the revenue it receives after settlement. Likewise, a smaller state can record high percentage growth from a lower starting point.
Which states and UTs saw post-settlement SGST revenue decline?
FY26 performance was not uniform across India. The official full-year figures show declines in post-settlement SGST revenue for Jammu and Kashmir, Mizoram, Tripura, Meghalaya, West Bengal, Jharkhand, Odisha, Chhattisgarh, Madhya Pradesh, Lakshadweep, Puducherry, and Ladakh.
Lakshadweep recorded a 74% decline, although the decline came from a very small base. Among larger states with declines, Chhattisgarh was down 14%, Jharkhand 12%, Odisha 9%, and Jammu and Kashmir 8%.
This divergence matters because national GST growth and state revenue growth answer different questions. India’s overall gross GST collections rose 8.3%, but that does not mean every state received 8.3% more GST revenue after settlement.
Why is Maharashtra India’s largest GST contributor?
Maharashtra’s position at the top of the state-wise GST table is consistent with the scale and diversity of its taxable economy and its large consumer market. Mumbai and Pune are particularly important centres of economic activity. The state combines several major economic centres and sectors, including:
- Financial and professional services
- Manufacturing
- Technology
- Automobiles
- Pharmaceuticals
- Media and entertainment
- Retail and consumer spending
Still, GST collections should not be viewed simply as taxes generated where a company has its headquarters or factory. GST is designed as a destination-based consumption tax. In broad terms, tax is linked to where goods or services are supplied or consumed under the applicable place-of-supply rules.
That makes Maharashtra’s large consumer base and formal economy relevant to understanding its position, but GST collections alone cannot tell us how large or wealthy the state economy is.
Does higher GST collection mean a state has a bigger economy?
Not necessarily. GST collection is an indicator of taxable economic activity, not a direct measure of a state’s economic size or wealth. Several factors influence state-wise GST collections:
- Size of the formal economy
- Household consumption
- Business spending
- Value of taxable transactions
- Services and manufacturing mix
- Interstate transactions and place-of-supply rules
- GST compliance and formalisation
There are also major parts of the economy that GST does not capture in the same way. Petrol, diesel, petroleum crude, natural gas, and aviation turbine fuel remain outside the GST levy until a date is notified on the GST Council’s recommendation. Alcoholic liquor for human consumption is also outside GST.
Exports are zero-rated under GST. That means export activity can contribute heavily to a state’s economy without producing an equivalent amount of domestic GST revenue.
For a fuller picture of a state economy, GST collections should be considered alongside Gross State Domestic Product (GSDP), per capita income, consumption, industrial output, and employment data.
State-wise GST versus SGST: a simple example
Suppose a business in Karnataka sells goods to a customer in Haryana. Because the transaction crosses state borders, IGST may be collected. The tax then has to be apportioned through the GST settlement system so that the destination state receives its appropriate share. This is why two different numbers can legitimately appear for the same state:
State-wise GST collection looks at the tax recorded for the state in the government’s domestic collection table.
Post-settlement SGST looks at the state’s GST revenue after the relevant interstate tax has been allocated.
Neither number is “more correct”. They simply answer different questions. For the ranking of India’s biggest GST-collecting states, this article uses the state-wise GST collection. For comparisons such as Haryana’s 22% growth, it uses post-settlement SGST, because that is the measure on which the growth figure is reported.
What do FY26 GST collections tell us about India’s economy?
Three trends stand out from the FY26 numbers.
GST collections are concentrated.
Maharashtra’s ₹3.62 lakh crore collection puts it far ahead of every other state in the FY26 state-wise table. Karnataka, Gujarat, Tamil Nadu, and Haryana also occupy prominent positions, reflecting the importance of major industrial, services, and consumption centres.
Population does not determine GST ranking.
Uttar Pradesh has India’s largest population but ranked sixth in state-wise GST collections. Haryana, despite its much smaller population, ranked fifth. This shows why formal economic activity, consumption, and the value of taxable transactions matter alongside population.
State revenue growth was uneven.
India’s overall gross GST collections increased 8.3%, but post-settlement SGST revenue did not grow at the same pace in every state. Haryana recorded particularly strong growth, while several states experienced declines on the same measure. The national GST number therefore tells only part of the story.
Key takeaways
- India’s gross GST collections reached about ₹22.27 lakh crore in FY26, an increase of 8.3% year-on-year.
- The national figure includes both domestic GST and GST collected on imports.
- Maharashtra ranked first in the government’s state-wise domestic GST table, with about ₹3.62 lakh crore.
- Karnataka, Gujarat, Tamil Nadu, and Haryana completed the top five.
- Maharashtra collected roughly 2.3 times as much as second-ranked Karnataka.
- Uttar Pradesh ranked sixth despite being India’s most populous state.
- Haryana recorded 22% growth in post-settlement SGST, the highest among states on that measure.
- Maharashtra’s post-settlement SGST reached about ₹1.96 lakh crore, up 13%.
- Several states recorded declines in post-settlement SGST revenue.
- Lakshadweep had the lowest state-wise GST collection at about ₹25 crore.
- State-wise GST collections and post-settlement SGST measure different things and should not be compared directly.
- GST data is useful for understanding taxable economic activity, but it is not a standalone ranking of state economic strength.
Sources and methodology
The national, state-wise, and post-settlement figures are based primarily on the GST Portal’s “GST Gross and Net Collections as on 31/03/2026” release, which contains the FY26 national totals, state-wise collections, and post-settlement figures.
For the main ranking, this article uses the government table showing GST collected from domestic transactions against each state and UT. GST collected on imports is not included in that ranking.
Post-settlement SGST figures are used separately when discussing how much GST revenue accrues to states after interstate GST is apportioned. Readers who want to understand the underlying mechanism can refer to the GST Council’s official FAQ on IGST and settlement between the Centre and states.
The legal framework for Integrated Goods and Services Tax (IGST), including the relevant Act, notifications, circulars, and instructions, is also available on the GST Council’s IGST resource page
Frequently Asked Questions (FAQs)
Q: Which state had the highest GST collection in India in FY26?
A: Maharashtra ranked first in the government’s state-wise GST collection table for FY26, with about ₹3.62 lakh crore. Karnataka ranked second at about ₹1.58 lakh crore.
Q: What were the top five states by GST collection in FY26?
A: Maharashtra, Karnataka, Gujarat, Tamil Nadu, and Haryana were the top five states in the FY26 state-wise GST collection table.
Q: How much GST did India collect in FY26?
A: India collected ₹22,27,096 crore, or about ₹22.27 lakh crore, in gross GST during FY 2025-26, an increase of 8.3% year-on-year. Net GST revenue after refunds was about ₹19.35 lakh crore.
Q: Why is the ₹22.27 lakh crore national GST figure different from the total of the state-wise table?
A: The national gross GST figure includes tax collected on imports. The state-wise ranking in this article covers GST collected from domestic transactions and recorded for individual states and UTs.
Q: What is SGST in simple terms?
A: State Goods and Services Tax (SGST) is the state government’s component of GST on eligible transactions that take place within the same state.
Q: What does post-settlement SGST mean?
A: Post-settlement SGST measures a state’s GST revenue after accounting for the interstate GST settlement process. In simple terms, it includes the state’s SGST revenue along with the relevant portion of IGST allocated to it.
Q: Why does the article use post-settlement SGST for Haryana’s 22% growth?
A: Because the 22% figure is growth in Haryana’s post-settlement SGST revenue, not growth in the ₹1.21 lakh crore state-wise GST collection figure. They are different measures.
Q: Which state recorded the fastest post-settlement SGST revenue growth in FY26?
A: Haryana recorded the highest cumulative post-settlement SGST growth among states at 22%.
Q: Does higher GST collection mean a state is richer?
A: No. GST collections reflect taxable transactions and revenue, not overall wealth. When comparing state economies, it is also necessary to consider GSDP, per capita income, industrial output, employment, and other measures.
Q: Is GST collected where goods are produced or consumed?
A: GST is a destination-based tax. Broadly, tax follows the place of supply or consumption rather than simply the location where a product is manufactured or a company has its headquarters.
Q: Are petrol and diesel included in GST?
A: No. Petrol and high-speed diesel remain outside the GST levy at present. They continue to be subject to taxes such as central excise duty and state value-added tax (VAT), as applicable.
Disclaimer
The stocks mentioned in this article are not recommendations. Please conduct your own research and due diligence before investing. Investment in securities market are subject to market risks, read all the related documents carefully before investing. Please read the Risk Disclosure documents carefully before investing in Equity Shares, Derivatives, Mutual fund, and/or other instruments traded on the Stock Exchanges. As investments are subject to market risks and price fluctuation risk, there is no assurance or guarantee that the investment objectives shall be achieved. Lemonn (Formerly known as NU Investors Technologies Pvt. Ltd) do not guarantee any assured returns on any investments. Past performance of securities/instruments is not indicative of their future performance.
Related Posts


Download Lemonn
Download my app for share market trading, ipo investment, trading account, and all your investment needs.