
MACD Indicator Explained: Crossovers, Histogram and Divergence
 Written by Supratim Choudhury
 Reviewed by Gaurav Garg, SEBI-registered Research Analyst
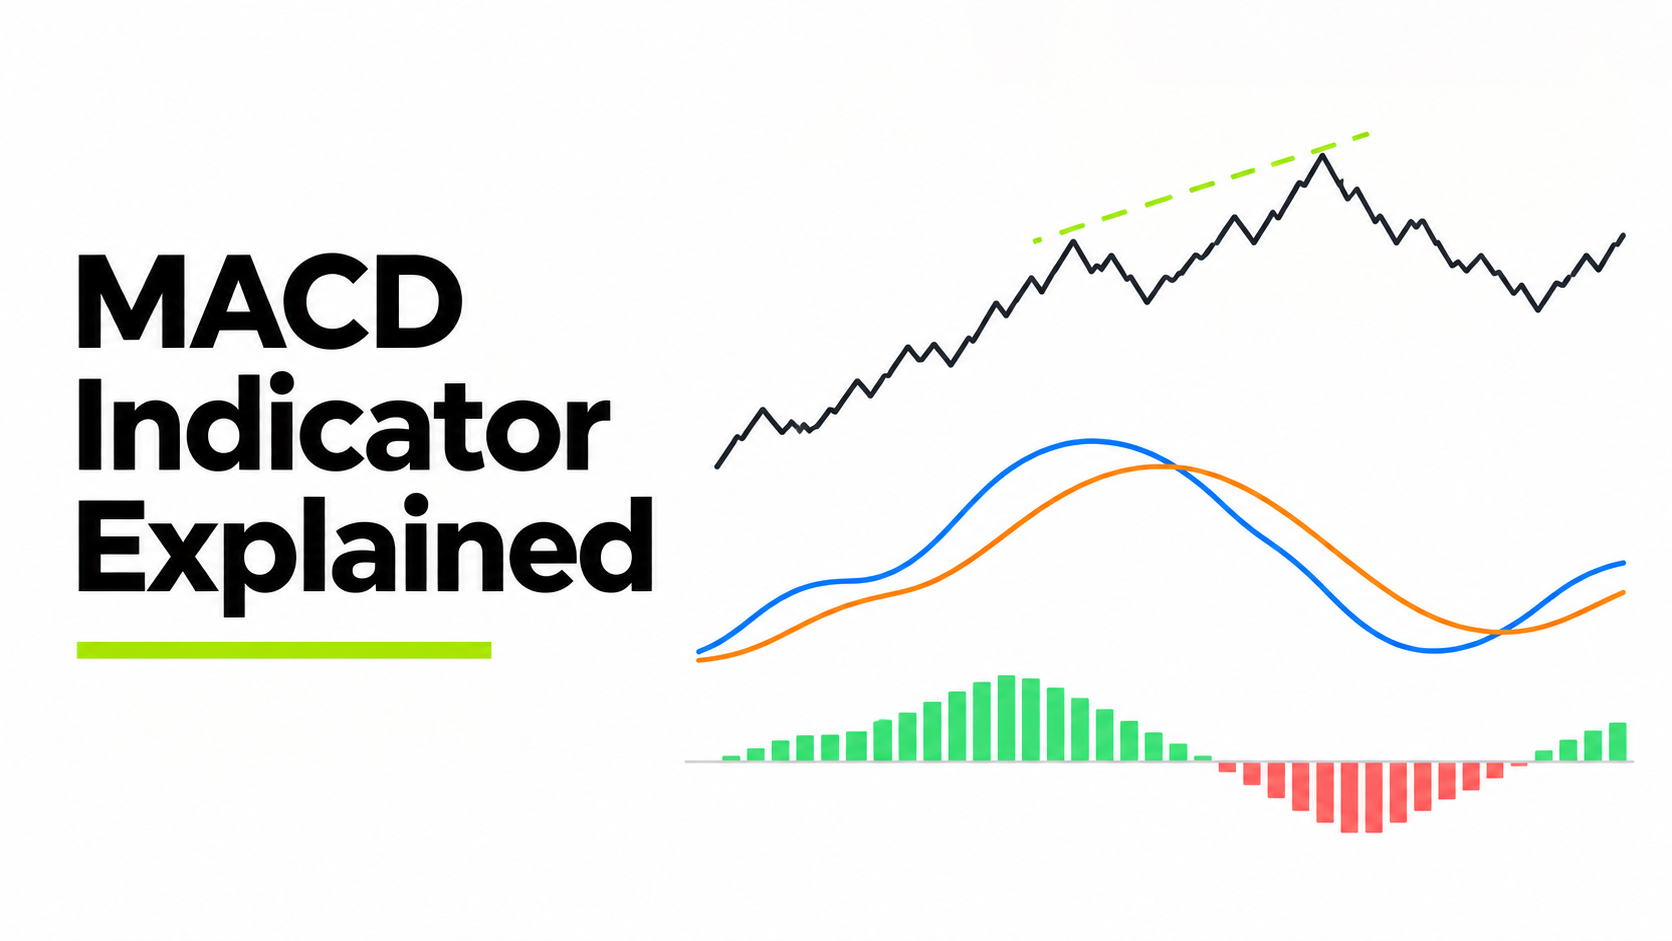
MACD indicator is one of the major indicators that traders often add to their setup for gauging stock momentum.
This signal can be identified via crossovers, histograms or divergences. But how exactly this indicator works? What’s the best way to use it? And what risks and benefits does it bring in?
Let’s take a closer look to MACD indicator.
MACD components
MACD is the acronym of Moving Average Convergence Divergence. An expert named Gerald Appel created this indicator. MACD offers information about how the EMAs or exponential moving averages relate to each other.
The MACD calculation is pretty simple. Here’s how it is done:
MACD Line
All you have to do is take the 12-period EMA and subtract the 26-period EMA from it.
MACD Line = 12-period EMA − 26-period EMA
If a stock has a 12-period EMA of ₹520 and a 26-period EMA of ₹510:
MACD = 520 − 510
MACD = 10
As the result is a positive number, this means the short-term EMA is higher than the long-term EMA.
If the short-term EMA drops below the long-term EMA, a negative result will be given.
Signal Line
The signal line is the 9-period EMA of the MACD line. As it is smoothed out, it can be used to identify changes in momentum.
Traders will look at changes in relation to the signal line.
Histogram
The histogram shows the difference between the MACD line and the signal line:
Histogram = MACD Line − Signal Line
If MACD = 10 and the signal line = 7:
Histogram = 10 − 7 = +3
All three components can be seen in the indicator beneath the price chart. Therefore, it is important to understand how they work in order to interpret any signals correctly.
Signal-line crossover
When the MACD crosses above or below the signal line, this forms a signal-line crossover.
This can give traders an indication of changes in momentum.
Bullish Crossover
A bullish crossover happens when the MACD crosses above the signal line.
If MACD = −5 and the signal line = −3, and MACD increases to −2 while the signal line stays at −3, this creates a bullish crossover.
This suggests that positive momentum is strengthening.
This may be considered a buy signal by some traders. It may also be a good buy signal if the price action supports a bullish move.
Bearish Crossover
A bearish crossover happens when the MACD crosses below the signal line.
If MACD = 8 and the signal line = 6, and MACD decreases to 5 while the signal line stays the same, this creates a bearish crossover.
This suggests positive momentum is beginning to decline, or negative momentum is increasing.
However, it is possible to receive misleading signals from crossovers, especially in range-bound conditions.
Traders will often take into account the current trend, support/resistance and volume in order to make a trading decision.
A bullish crossover may mean different things in a downtrend than in an uptrend.
Zero-line crossover
Another key line on the MACD indicator is the zero line.
It tells you whether the short-term EMA is above or below the long-term EMA.
A zero-line crossover occurs when the MACD crosses from positive to negative or negative to positive.
Crosses Positive Line
If the MACD crosses above the zero line, it indicates that the short-term EMA has crossed above the long-term EMA.
And this implies that the short-term momentum is rising as compared to the long-term momentum. So this might be a sign of trend improvement.
Crosses Negative Line
But if the MACD crosses below the zero line, it means that the short-term EMA has crossed below the long-term EMA.
This suggests that momentum is weakening. It could indicate that negative momentum is building up.
As this indicator is based on moving averages, large movements in price may cause zero-line crossovers.
Therefore, it may be that the trader enters the trade at a later point in comparison to a signal-line crossover.
It is also possible for momentum to weaken while the MACD remains positive. Similarly, selling momentum may begin to weaken while the MACD is negative.
Consider the overall trend in order to interpret the signals.
Histogram reading
The histogram shows how far apart the MACD line and the signal line are.
Below is a table showing what it means depending on the value.
| Value | Meaning |
|---|---|
| Positive and increasing | Increasing the distance from the signal line |
| Positive and decreasing | Closing the gap |
| Negative and decreasing | Moving further away from the signal line |
| Negative and increasing | Closing the gap |
| Crosses zero | MACD line and signal line have crossed |
If the histogram increases from +2 to +4 and then +6, this means that the gap between the MACD line and the signal line is increasing.
If the histogram decreases from +6 to +3, this means that positive momentum in comparison to the signal line is decreasing.
However, just because the histogram is decreasing in positive value, it doesn’t necessarily mean the price of the stock is decreasing. Price may still be increasing, but the distance between the lines is closing.
If the histogram is negative and increasing, it may indicate that momentum is improving, even though the price may be in a downtrend.
Price action should be taken into consideration for this signal.
Divergence
Divergence occurs in the MACD indicator when there is a discrepancy between price action and MACD values. This may indicate that momentum in an existing trend is changing.
Bullish Divergence
Bullish divergence occurs when price makes a new low, but MACD makes a higher low.
Suppose the price of a stock falls to ₹450 and the MACD value is −12.
Later, the price falls again to ₹440; however, the MACD value increases to −7.
Despite the price making a new low, the MACD value suggests that negative momentum is reducing.
This may be an indication of a possible reversal.
Bearish Divergence
Bearish divergence occurs when price makes a new high, but MACD makes a lower high.
Suppose the price of a stock increases to ₹600 with the MACD value at 15, and then increases again to ₹620 with the MACD value at 9.
This means that price has increased, but momentum has reduced.
However, divergence can occur over many periods without a reversal.
Many divergence signals may be formed in strong trends, but price may continue moving in the same direction.
For this reason, traders may require further confirmation to make trading decisions from MACD signals. They may consider price action, support/resistance and crossovers.
Best settings
The most common MACD settings are 12, 26, 9.
- 12 periods (short-term EMA).
- 26 periods (long-term EMA).
- 9 periods (signal-line EMA).
These can be applied to daily timeframes. However, they can also be applied to intraday and weekly timeframes.
Some traders will change the settings depending on their style.
| Settings | Description | Disadvantages |
|---|---|---|
| 12, 26, 9 | Standard sensitivity | May be delayed during rapid changes |
| 6, 13, 5 | Quick response | More false signals |
| 19, 39, 9 | Smoother line | Delayed signals |
Changing MACD settings to shorter periods means it is more sensitive to recent price changes. However, this may mean false signals occur more frequently.
Longer periods will smooth out the data but may cause delays in signals.
Intraday traders may apply standard settings to 5-minute or 15-minute charts. However, frequent changes in momentum may lead to false signals. Consider price confirmation and risk management.
There are no perfect settings to apply to all instruments and conditions.
FAQs
What are MACD default settings?
The default settings are 12, 26, 9. However, traders may change these depending on their timeframe and strategy.
Is MACD lagging?
Yes. As MACD is based on moving averages, which are calculated using previous price data, signals may come late, especially during periods of rapid price changes.
MACD vs RSI?
MACD identifies trends and changes in momentum by analysing relationships between moving averages. RSI measures recent gains and losses in price and ranges between 0 and 100. Using both indicators can give different insights into momentum.
Can I use MACD for intraday?
Yes. MACD can be applied to intraday charts, such as 5-minute and 15-minute charts. However, there may be frequent crossovers and market noise, which may cause false signals. Consider price confirmation and risk management.
Conclusion
The MACD indicator can be useful in identifying momentum in a stock. Traders can use signal-line crossovers, zero-line crossovers, histograms and divergences. The default settings may be useful as a starting point; however, different settings can be applied for different timeframes.
However, MACD can lag behind price movements and may not be reliable in ranging conditions. Consider price action, market conditions and risk management before making trades.
Ready to apply your technical analysis knowledge?
Download Lemonn, your stock trading and investing app, and start analysing Indian stocks. Using charting tools, you can analyse market trends, technical indicators and create your own trading strategy.
Disclaimer
The stocks mentioned in this article are not recommendations. Please conduct your own research and due diligence before investing. Investment in securities market are subject to market risks, read all the related documents carefully before investing. Please read the Risk Disclosure documents carefully before investing in Equity Shares, Derivatives, Mutual fund, and/or other instruments traded on the Stock Exchanges. As investments are subject to market risks and price fluctuation risk, there is no assurance or guarantee that the investment objectives shall be achieved. Lemonn (Formerly known as NU Investors Technologies Pvt. Ltd) do not guarantee any assured returns on any investments. Past performance of securities/instruments is not indicative of their future performance.