Technical Analysis for Beginners: A Complete Guide
 Written by Ipsita Baishya
 Reviewed by Gaurav Garg, SEBI-registered Research Analyst
There are multiple factors that determine an asset’s movement. Some of them are macro-economic factors, while some are recent events. Then there are some factors that rely on historical trends. Some traders often use these factors and historical price movements to identify support and resistance zones.
This method is known as technical analysis. Traders often use technical analysis to supplement their fundamental analysis. On the contrary, some traders rely solely on technical analysis to take their positions.
But what exactly is technical analysis and how does it work?
Let’s dive deeper to understand.
What Technical Analysis Is
Technical analysis examines price and volume data to assess possible future market movements.
Let’s take a stock that trades at ₹300. Over the few weeks, it climbs to ₹350, falls to ₹325 and then moves up to ₹380. Now look at those prices again. The stock has made a higher high. Even during the correction, it stayed above its previous low of ₹300.
A technical analyst may see the signs of an uptrend.
Three ideas form the basis of analysis:
- Prices reflect market information
- Prices can follow trends
- Patterns may repeat
Sounds simple? Well, there’s a catch!
Markets can change direction suddenly. For example, a single event or an announcement from the management can negate the effect of a perfect technical analysis setup!
Price Action vs Indicators
Technical analysis has two primary elements, price action and indicators. They both generally work in conjunction to offer a detailed view of a price trend.
Price Action
Price action focuses on what the price itself does. Suppose a share reaches ₹500 and falls. A few days later it approaches ₹500 again. Another decline follows.
Then it happens for the third time. Clearly something is preventing the price from moving.
Traders may identify ₹500 as resistance. Now if the stock finally crosses ₹500 they may examine the move as a breakout.
Technical Indicators
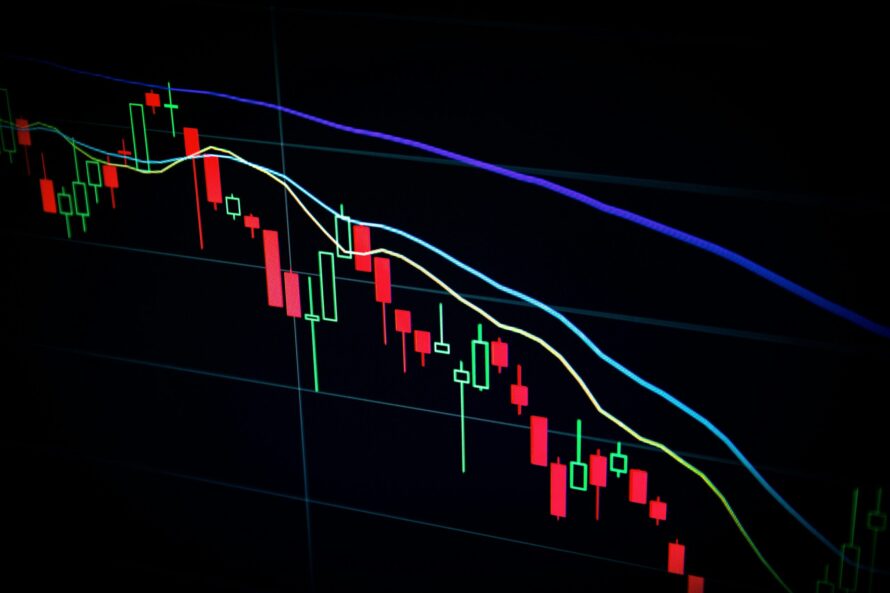
Indicators calculate information from market data. For instance, a moving average shows the average price over a selected period. RSI measures price momentum.
They help traders examine aspects of a stock’s behaviour. Here’s a quick comparison
| Feature | Price Action | Indicators |
|---|---|---|
| Focus | Direct price movements | Calculated market signals |
| Tools | Candles, support, resistance | RSI, MACD, moving averages |
| Main purpose | Examine price behaviour | Assess trends and momentum |
| Limitation | Subjective interpretation | Delayed or false signals |
Many traders use both. The price chart provides the context while indicators offer information.
Chart Types
A stock chart may look simple. The way it presents prices makes a difference.
Three chart types are particularly common.
Line Chart
A line chart connects selected prices, usually closing prices.
Want to know how a stock performed over six months?
This chart gives you a picture.
However, it generally leaves out the price movements between the opening and closing prices.
Bar Chart
A bar chart shows four prices for each period:
- Open: The first traded price.
- High: The highest traded price.
- Low: The lowest traded price.
- Close: The final traded price.
Traders call these OHLC values.
Candlestick Chart
Candlestick charts show the OHLC via rectangular bodies called candle bodies and thin lines called wicks. Let’s say a particular stock opens at ₹400.
In the market hours, the share shoots up to ₹430 and drops to ₹390. Finally, the share closes at ₹420.
That’s a ₹40 price range, with the closing price ₹20 above the opening price.
There are different types of candlestick chart patterns like doji, hammer, shooting stars and engulfing candles. These charts explain the sentiment of that stock.
A hammer after a steep decline may indicate that buyers have started to respond. The same candle during a sideways market might mean very little.
One candle. Different circumstances. Different interpretations.
Trends, Support and Resistance
A stock rises from ₹100 to ₹130. Then it falls to ₹115. A session later, it touches ₹150.
Notice anything? The latest peak is higher than the earlier one. The correction also stopped above the earlier starting price.
Traders may interpret this as a trend.
Types of Trends
- Uptrend: When the prices hit higher highs and higher lows.
- Downtrend: When the prices hit lower highs and lower lows.
- Sideways Trend: When the prices move in a defined range.
What Is Support?
Support is an area where buyers have previously shown interest.
Imagine a stock falling towards ₹250 on three occasions. Every time, buyers push it up. That ₹250 level may act as support.
What Is Resistance?
Resistance is an area where sellers have previously restricted price increases. Let’s say a stock reaches ₹600 multiple times. But it fails to cross that particular level. This means ₹600’s level is called resistance. Now imagine it finally moves above ₹600 and closes at ₹620.
A trader may consider this a breakout.
But does this mean any breakout above resistance guarantees gains?
Not at all.
A breakout can fail within hours. Support can disappear during selling. Remember, a level that held for months may collapse after one unexpected announcement.
That is why traders usually work with price zones and prepare for outcomes.
Key Indicators
Open a charting platform. You will probably find dozens of indicators.
Some look useful. Others seem complicated.
Let us focus on five that beginners commonly encounter.
1. Moving Average (MA)
A moving average is calculated using the average price over a selected period. For example, if we want to calculate a 50-day moving average, we have to take an average of the closing price of that stock during the last 50 days.
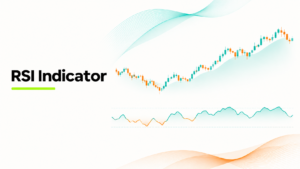
2. Relative Strength Index (RSI)
RSI is the measurement of any stock’s price momentum on a scale of 0 to 100.
Common reference levels include:
- Above 70: Potentially overbought.
- Below 30: Potentially oversold.
- Around 50: Momentum reference level.
Now suppose RSI reaches 75.
Does the stock have to fall?
No. During a rally, RSI can remain above 70 for several sessions.
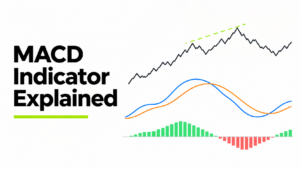
3. MACD
Moving Average Convergence Divergence, or MACD, is a comparison of multiple moving averages. It can help gauge the momentum.
Traders examine the MACD line, signal line and crossovers.
However, sideways markets can produce repeated signals that do not lead to price movements.
4. Bollinger Bands
Bollinger Bands use a moving average and two bands based on volatility.
When measured volatility increases, the bands widen.
During low-volatility periods, they narrow.
5. Volume
Volume measures how many shares or contracts change hands during a period.
Suppose a stock finally crosses ₹500 after four attempts.
This time volume is significantly higher than usual.
The increased activity may suggest market participation in the breakout.
Building a Simple System
If you have knowledge of indicators, it can be useful. But to use them collectively, you need a dedicated system. Here’s how to build one.
Step 1: Choose a Stock
Pick a stock of your liking and open its daily chart.
Step 2: Identify the Trend
Add a 50-day moving average.
For this example, consider a purchase only when the stock trades above a rising average.
Step 3: Find Resistance
Suppose the stock has tried to cross ₹500 five times.
No success yet.
Mark ₹500, as the resistance area.
Step 4: Decide the Entry
Wait for the stock to close above ₹500 with volume.
Let us say it closes at ₹505.
Now the conditions match the plan.
Step 5: Calculate the Risk
Consider these levels:
- Entry: ₹505
- Stop-loss trigger: ₹490
- Target: ₹535
The planned risk is ₹15 per share.
The potential reward is ₹30.
That is a 2:1 reward-to-risk ratio before charges.
The actual losses may exceed the planned amount if prices gap or if an order executes at an unfavourable price.
Step 6: Test the System
Look at past market movements.
How often would these rules have produced a trade?
What about the losses?
How much would transaction costs have reduced the returns?
Also examine different markets and timeframes.
FAQs
Does technical analysis work?
Well, it’s not a magic wand. But it can surely help you identify trends and key levels. But remember, there is no guarantee that technical analysis can offer you a perfect entry-exit setup.
Which timeframe is best?
It depends on what type of trader you are. If you are a long-term investor, a weekly or monthly chart can prove useful. Let’s say you are a short-term or a medium-term trader. Then a daily or hourly time frame can be used. But if you are a scalp-trader or a day-trader, shorter time frames like 15 minutes or 5 minutes can prove helpful.
How long to learn TA?
It depends on how in-depth study you want to do. You can understand the basics in the short term, but mastering it can take more time.
TA vs Fundamental analysis?
Technical analysis examines prices and volumes. Fundamental analysis examines company finances, business performance and valuation.
Conclusion
Technical analysis is an excellent way to analyze historical price movements and trends. A combination of charts and technical indicators can give an idea about how the price of a particular asset might move in the future.
And you can set up your trades based on this information, given other factors support the setup too.
We hope this blog has offered you enough basic information so that you can get started with your technical analysis.
Meanwhile, you can open your Demat account with Lemonn and can start trading smartly. Till then, safe investing!
Disclaimer
The stocks mentioned in this article are not recommendations. Please conduct your own research and due diligence before investing. Investment in securities market are subject to market risks, read all the related documents carefully before investing. Please read the Risk Disclosure documents carefully before investing in Equity Shares, Derivatives, Mutual fund, and/or other instruments traded on the Stock Exchanges. As investments are subject to market risks and price fluctuation risk, there is no assurance or guarantee that the investment objectives shall be achieved. Lemonn (Formerly known as NU Investors Technologies Pvt. Ltd) do not guarantee any assured returns on any investments. Past performance of securities/instruments is not indicative of their future performance.