RSI Indicator: Meaning, Formula and Trading Strategies
 Written by Prateek Desai
 Reviewed by Gaurav Garg, SEBI-registered Research Analyst
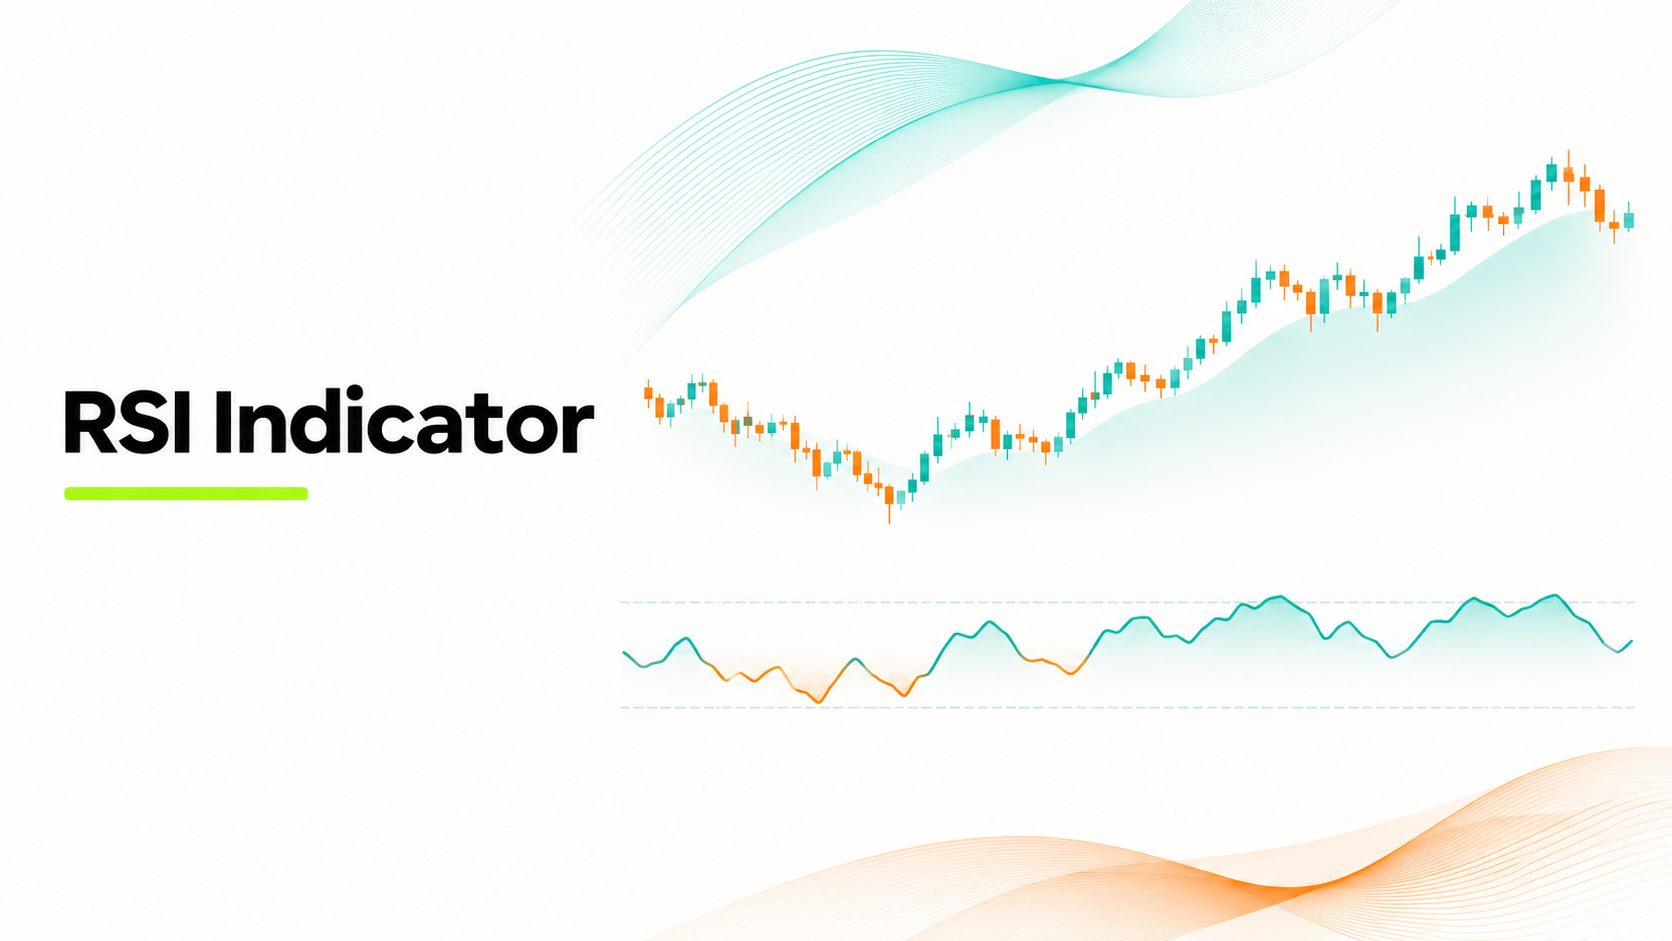
RSI can be used to see the relationship between recent price increases and decreases. RSI values can be used to identify strong momentum, potential exhaustion and changes in direction. However, predictions cannot be made from the value alone.
Traders interpret the RSI indicator in the following way:
What RSI measures
RSI stands for Relative Strength Index. It oscillates between 0 and 100. It shows how large the gains in price over recent periods (measured by closing prices) are compared to losses over the same period. The calculation uses a specified number of periods.
Typically, 14 periods are used. On a daily chart, this would be 14 trading days. On a 5-minute chart, this would be 14 five-minute candles. It compares price movements of the same stock or instrument, not different stocks.
If a stock has increased in price consistently, with large gains and small losses, RSI will typically increase. If there are more losses recently, RSI will typically decrease. RSI values around 50 imply that the average gain and average loss, after smoothing, are roughly equal.
RSI can be used to identify momentum, overbought/oversold conditions and discrepancies between price and momentum. RSI can be applied to stocks, indices and other instruments with available price data.
It cannot predict sudden changes due to surprising news or large price gaps. RSI levels can remain elevated during a rising trend for long periods of time.
Formula
To calculate RSI, calculate the difference in price between consecutive closing prices. If positive, the difference can be added to the gains. If negative, it can be added to the losses, taking the absolute value. If a price change is negative, add 0 to the gain, and vice versa.
RS = Average Gains / Average Losses
RSI = 100 − [100 ÷ (1 + RS)]
Over 14 periods, the average gain and average loss can be found by taking the average of 14 price changes. Moving forward, Wilder applies smoothed averages to calculate RSI. This is done to allow the RSI value to be calculated for each period while still applying a smoothing technique.
If average gains are ₹6 and average losses are ₹3:
RS = 6 / 3 = 2
RSI = 100 − (100 / (1 + 2)) = 66.67
This shows that there has been stronger upward price movement than downward movement over recent periods. This does not mean that there is a 66.67% chance of upward movement.
In a 14-period RSI calculation, average gains can be calculated by multiplying the previous average gain by 13, adding the current gain and dividing by 14. The average losses can be calculated in the same way.
If the average loss is zero and gains are positive, RSI will be 100. If the average gain is zero and losses are positive, RSI will be 0.
This calculation will be completed automatically on trading platforms. However, past price data can impact RSI values.
Overbought/oversold levels
Common values to consider within RSI are 70 and 30.
| RSI Value | Interpretation | Notes |
|---|---|---|
| Above 70 | Overbought | Price may continue to increase |
| Around 50 | Even momentum | Momentum confirmation needed |
| Below 30 | Oversold | Price may continue to decrease |
Note that high RSI values (overbought) simply mean that there has been strong upward momentum recently. This does not necessarily mean that the price of the stock is overvalued or that you should sell.
Similarly, low RSI values (oversold) simply mean that there has been significant downward momentum recently. This doesn’t necessarily mean it is a good buy.
If a stock is in a strong upward trend, even though RSI increases above 70, the stock price could continue to make new highs. If you sell based purely on RSI increasing above 70, you may miss out on the trend.
If a stock is in a prolonged downward trend, RSI may remain below 30, and the price may continue to fall. If negative news is causing the fall in price, a single oversold signal may be very misleading.
RSI divergence
RSI divergence happens when the asset price and its RSI goes in the opposite direction at almost similar swing points. So what this means? Well, this means the momentum might be changing.
Bullish Divergence: This happens when the price has made a new low. But at the same time, RSI has a higher low. This means, while the price might be under pressure, the selling momentum is dropping.
Bearish Divergence: This happens when the price makes a new high, but the RSI makes a new lower high. This means, buying is happening but the momentum is reducing.
So if stock price drops to ₹480 (RSI of 24) and then drops further to ₹470 (RSI of 32), it could be a sign of bullish divergence. Traders generally confirm this with some other indicators to be sure.
The RSI indicator can give an early indication. But the price movement is important too as it helps identify good entry and exit points.
RSI strategies
Here are some strategies that the traders often use.
Overbought/Oversold Reversals
If RSI falls below 30 and then rises above 30 as price creates support, it might be a bullish sign. Similarly, if the RSI is dropping below 70 at resistance, it might be due to reduction in the momentum.
Trend Continuation
If a stock is moving up, some traders look whether the RSI is dipping into the 40–50 range and then rising again. In downward trends, some traders may consider RSI rising into the 50–60 range to indicate weakening momentum. These are general ranges.
Divergence at Support/Resistance
If bullish divergence occurs at a known support level, it may be of interest. Traders may then consider waiting for price to cross above a nearby swing high. Similarly, bearish divergence at resistance can be analysed.
Risk Management
Consider how large a position you want to take, at what point you will invalidate the trade and at what points you want to exit. Be aware that transaction costs, gaps and slippage can affect results. Backtest strategies in different scenarios.
Using the RSI indicator as part of a consistent strategy can make it more useful.
Settings
By default, RSI uses 14 periods. This can be used with levels at 70 and 30. It is a good starting point for many people. However, there is no one ‘best’ setting.
If fewer periods are used (for example, 7), RSI will be more sensitive to price changes. This means extreme values may be reached more frequently, potentially resulting in more false signals.
If more periods are used (for example, 21), RSI may be less sensitive and appear smoother.
| Setting | Sensitivity | Issues |
|---|---|---|
| 7 periods | Fast | More noise |
| 14 periods | Standard | May lag during fast changes |
| 21 periods | Smooth | Delayed signals |
Intraday traders may wish to use 5- or 15-minute intervals. Swing traders may prefer daily charts. Using 14 periods on 5-minute candles will give a value based on 14 candles, meaning it may change faster than a daily chart.
Some traders may change overbought/oversold levels in strongly trending markets to 80 and 20. Be careful when making these changes. Past performance may differ from real-time trading.
FAQs
What is a good RSI setting?
Traditionally, 14 periods with 70/30 levels is a good place to start. Shorter time periods will be more sensitive to price changes. Longer time periods will create smoother values. Try different settings depending on the timeframe and strategy.
Is RSI 70 a sell signal?
No. It indicates that there has been strong upward momentum recently. It is traditionally seen as overbought. However, prices may continue to increase beyond 70. Consider the current trend and price confirmation before taking any action.
What is RSI divergence?
Price has formed a new swing high/low, but RSI has not confirmed it. It may indicate a change in momentum. No guarantees can be made about a price reversal.
Does RSI work intraday?
Yes. RSI can be calculated for intraday time periods. Due to the short timeframes, there may be more noise. Consider volatility, liquidity and price confirmation.
Conclusion
The RSI indicator is very simple to understand. Understanding the calculations, overbought/oversold levels, divergence and customisable settings can help traders understand charts. Along with price movements and strict risk management, especially in more volatile markets, RSI can be a useful tool.
To get started with these ideas using real market data, download Lemonn, your stock trading and investing app. You can view stocks in India, analyse them using charting tools and understand market movements while developing a research process.
Get started with Lemonn today and make more prepared trading decisions!
Disclaimer
The stocks mentioned in this article are not recommendations. Please conduct your own research and due diligence before investing. Investment in securities market are subject to market risks, read all the related documents carefully before investing. Please read the Risk Disclosure documents carefully before investing in Equity Shares, Derivatives, Mutual fund, and/or other instruments traded on the Stock Exchanges. As investments are subject to market risks and price fluctuation risk, there is no assurance or guarantee that the investment objectives shall be achieved. Lemonn (Formerly known as NU Investors Technologies Pvt. Ltd) do not guarantee any assured returns on any investments. Past performance of securities/instruments is not indicative of their future performance.