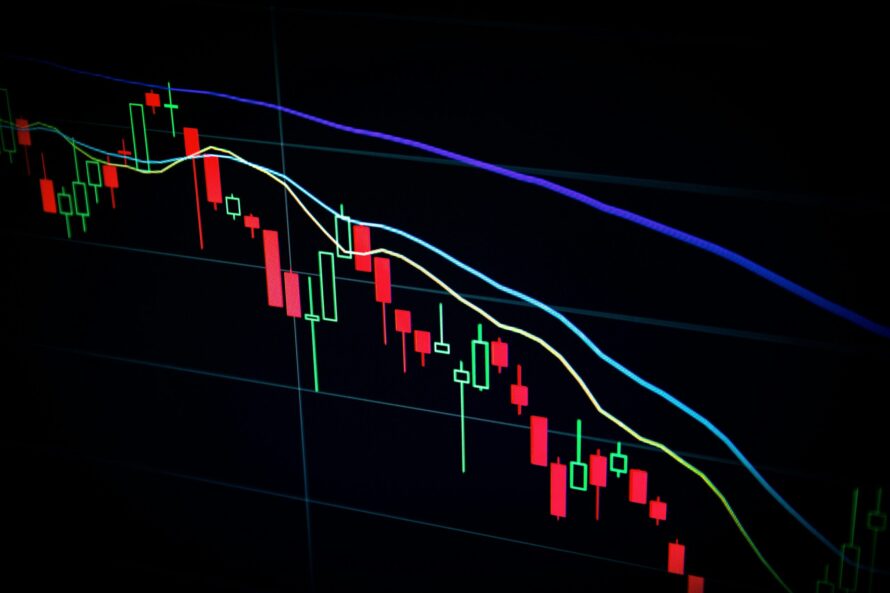
Support and Resistance: How to Draw and Trade Them
 Written by Kumar Ashutosh
 Reviewed by Gaurav Garg, SEBI-registered Research Analyst

A stock falls to ₹300. Buyers enter, and the price recovers. A week later, it drops towards ₹300 again.
Another recovery.
Then it happens for the third time.
What’s so special about ₹300? Why do buyers keep showing interest around that price? And the most important question: why do some stocks struggle to cross or break a certain price level, even after multiple attempts?
These are the kinds of price movements traders examine through support and resistance.
But how do you draw these levels? Do they always work? What happens when prices break through them?
Let’s find out.
Definitions
Support and resistance are price areas where buyers or sellers have previously influenced a stock’s movement.
They often appear around earlier highs, lows and areas where prices have changed direction.
What Is Support?
Suppose a stock trades at ₹350.
Over the next few sessions, it falls to ₹300. Buyers enter, and the price recovers to ₹330.
A week later, it falls towards ₹300 again. And once again, the price rises. Now ₹300 becomes an important area to watch.
Why?
Because buyers have repeatedly shown interest around that price. Traders may call it support.
What Is Resistance?
Now consider another stock. It trades at ₹450 and climbs to ₹500. But it can’t cross ₹500. Sellers appear, and the price falls.
A few days later, it reaches ₹500 again. Same result. After several attempts, traders may identify ₹500 as resistance.
Support vs Resistance
| Feature | Support | Resistance |
|---|---|---|
| Price behaviour | Declines may slow or reverse | Rallies may slow or reverse |
| Market activity | Buying interest | Selling interest |
| Usually found | Below the current price | Above the current price |
| If broken | May become resistance | May become support |
Drawing Horizontal Levels
Now let’s talk about the practical part. Understanding levels is one thing, but drawing them on a chart is another! If this is the first time you are plotting levels, keep your chart simple. Don’t add a lot of indicators to your chart.
Step 1: Choose a Timeframe
Open the chart of your favourite stock. A daily chart can be a good beginning. It will give you a broader start as it offers broader price levels. Intraday traders may examine 15-minute or five-minute charts for shorter-term price movements.
But here’s the difference. You might find some levels in one time frame that look too promising. But as you switch the time frame, they might lose their importance.
So it’s critical that you pick the timeframe based on your trading approach and trade setup.
Step 2: Find Previous Highs and Lows
Look for areas where prices have repeatedly changed direction.
Suppose a stock shows these movements:
- Falls to ₹400 and recovers.
- Drops to ₹405 a few sessions later.
- Touches ₹398 before another recovery.
- Reaches ₹480 twice but fails to cross it.
Notice anything?
The price repeatedly recovers around ₹400.
And ₹480 seems to restrict further gains.
These could be support and resistance areas.
Step 3: Draw the Levels
Mark the ₹398–₹405 area as possible support. Then mark ₹480 as resistance.
Why a zone around ₹400?
Because prices rarely reverse at exactly the same number. ₹398 today. ₹403 tomorrow. Perhaps ₹405 next week.
They may all represent reactions around the same support area.
Step 4: Examine the Reactions
Did the stock recover sharply? Was trading volume unusually high? Has the price reacted around that level several times?
When you find the answers to these questions, you can gauge how important these particular levels are. Now there is a catch here! When a specific support or resistance is tested again and again, it might break that level.
Reason? Repeated testing of levels makes those levels weaker over time.
How Can Traders Use These Levels?
Let’s say a stock trades at ₹420. It has a support level near ₹400 and resistance at around ₹480.
A trader may examine a possible purchase near ₹400 if the price shows signs of recovery.
But what if the stock falls to ₹390?
The earlier support may have failed. And that changes the trade.
Dynamic Support (Moving Averages)
Horizontal support is easy to understand. A stock falls to ₹300 several times. Buyers enter. You mark the area.
But what happens when a stock keeps rising?
₹500. ₹540. ₹580. ₹620.
The price doesn’t return to its earlier support. That’s where moving averages may help.
What Is Dynamic Support?
Dynamic support refers to a potential support area that changes as new prices become available. A moving average is one commonly used example. It calculates the average price over a selected number of periods. As new prices enter the calculation, the average changes.
Some common examples:
- 20-period moving average
- 50-day moving average
- 200-day moving average
Let’s Take an Example
A stock rises from ₹500 to ₹650 over several months.
Its 50-day moving average also moves higher.
Now the stock begins to fall.
₹640. ₹625. ₹610.
Eventually, it approaches the moving average.
Buyers return, and the price recovers.
A few weeks later, the same thing happens.
Traders may start watching the average as dynamic support. But will the stock bounce every time?
No.
Sometimes it breaks below the average and continues falling. And if the market goes sideways, prices might cross moving averages so many times that these signals become useless.
Role Reversal
Here’s something interesting. A stock struggles to cross ₹500 for several weeks. Then it finally breaks above ₹500 and reaches ₹530.
A few sessions later, the price falls back towards ₹500. You might expect another decline. But buyers enter. The price recovers.
Now ₹500 appears to be acting as support. The same level that previously stopped the stock from rising is now restricting its decline. That’s role reversal.
When Resistance Becomes Support
Suppose ₹500 has acted as resistance. The stock crosses it and closes at ₹520. Later, it returns to ₹500.
If buyers enter and push the price higher, traders may consider the former resistance a possible support area.
When Support Becomes Resistance
Now consider the opposite.
A stock has remained above ₹300 for weeks. Then heavy selling pushes it down to ₹280. A few days later, it climbs towards ₹300.
But sellers appear. The stock falls again. The old support may now be acting as resistance.
Why does this happen? Some traders remember earlier price levels. Others may place orders around areas where they previously bought or sold.
These reactions can influence prices. But role reversal isn’t guaranteed. Sometimes a broken level has very little effect on future price movements.
Breakouts vs Fakeouts
A stock hasn’t crossed ₹600 for almost a month. One morning, it reaches ₹615. Volume increases. Buyers appear active. A breakout?
Maybe. But what happens next is critical.
What Is a Breakout?
A breakout occurs when the price moves beyond an established support or resistance area. Suppose the stock has repeatedly struggled near ₹600.
Then it closes at ₹615. Traders may see this as a potential upward breakout.
If buying interest continues, the price may move higher. But there’s another possibility.
What Is a Fakeout?
The stock reaches ₹615. Traders enter, expecting further gains.
The next session begins. ₹605. ₹598. ₹590.
Now the price is back below ₹600. The breakout has failed. This is called a fakeout, or false breakout.
Breakout vs Fakeout
| Feature | Breakout | Fakeout |
|---|---|---|
| Price movement | Moves beyond a key level | Crosses, then reverses |
| Volume | Higher volume may support the move | Can vary |
| Follow-through | Price continues beyond the level | Price returns to its earlier range |
| Risk | The move may still fail | Traders may enter before a reversal |
How Can Traders Plan a Trade?
Let’s take a hypothetical setup.
A stock has resistance around ₹500.
After several attempts, it closes above that level at ₹505.
A trader considers these prices:
- Entry: ₹505
- Stop-loss trigger: ₹490
- Target: ₹535
Planned risk per share:
₹505 − ₹490 = ₹15
Potential reward:
₹535 − ₹505 = ₹30
That gives a 2:1 reward-to-risk ratio, before charges.
Sounds reasonable?
Now imagine the stock closes at ₹505 but opens at ₹480 the next morning.
The actual loss could be much larger than ₹15 per share.
There’s also the chance that the stock moves sideways for several sessions. No target. No clear direction.
Some traders wait for a retest of the broken resistance. Others examine volume, candlesticks and the broader trend.
FAQs
How do I find strong support?
Look for areas where prices have repeatedly recovered. Previous lows, volume and moving averages may provide additional clues. No support level is guaranteed.
What is a breakout?
A breakout occurs when a stock moves beyond an established support or resistance area. The movement may continue or reverse.
What is role reversal?
Role reversal happens when broken resistance later acts as support, or broken support acts as resistance.
Do round numbers act as support?
Interestingly, they do sometimes! The reason is, these levels are considered psychological levels. So the traders often take trades at these levels.
Conclusion
Support and resistance help traders understand how a stock might react at certain levels.
Stocks have a tendency to recover around support levels and fall from the resistance levels. While it does not always happen as a number of factors affect reversals. But these levels can surely help traders with their trade setups.
We hope this blog has clarified a lot of your doubts about support and resistance. Feel free to subscribe to our social channels for more such informative posts.
For the best stock trading platform, explore Lemonn today.
Disclaimer
The stocks mentioned in this article are not recommendations. Please conduct your own research and due diligence before investing. Investment in securities market are subject to market risks, read all the related documents carefully before investing. Please read the Risk Disclosure documents carefully before investing in Equity Shares, Derivatives, Mutual fund, and/or other instruments traded on the Stock Exchanges. As investments are subject to market risks and price fluctuation risk, there is no assurance or guarantee that the investment objectives shall be achieved. Lemonn (Formerly known as NU Investors Technologies Pvt. Ltd) do not guarantee any assured returns on any investments. Past performance of securities/instruments is not indicative of their future performance.