Implied Volatility (IV) in Options: Meaning and Uses
 Written by Supratim Choudhury
 Reviewed by Gaurav Garg, SEBI-registered Research Analyst
At times, you may be investing in Nifty call options, only to find out that you have made very little profit (or possibly a loss) in the 20 minutes since purchasing.
Why?
Option premiums reflect expectations. If expectations change quickly, then option premiums can also change quickly, even with little movement in the market.
Even if you were correct about the direction of the movement in an option, if the session was very quiet (unexpectedly), then your expensive long option may still underperform. The magnitude and timing of price movements are equally important as direction.
In this blog, we will dissect the concept of implied volatility and try to eliminate any confusion you have about the same!
What IV is
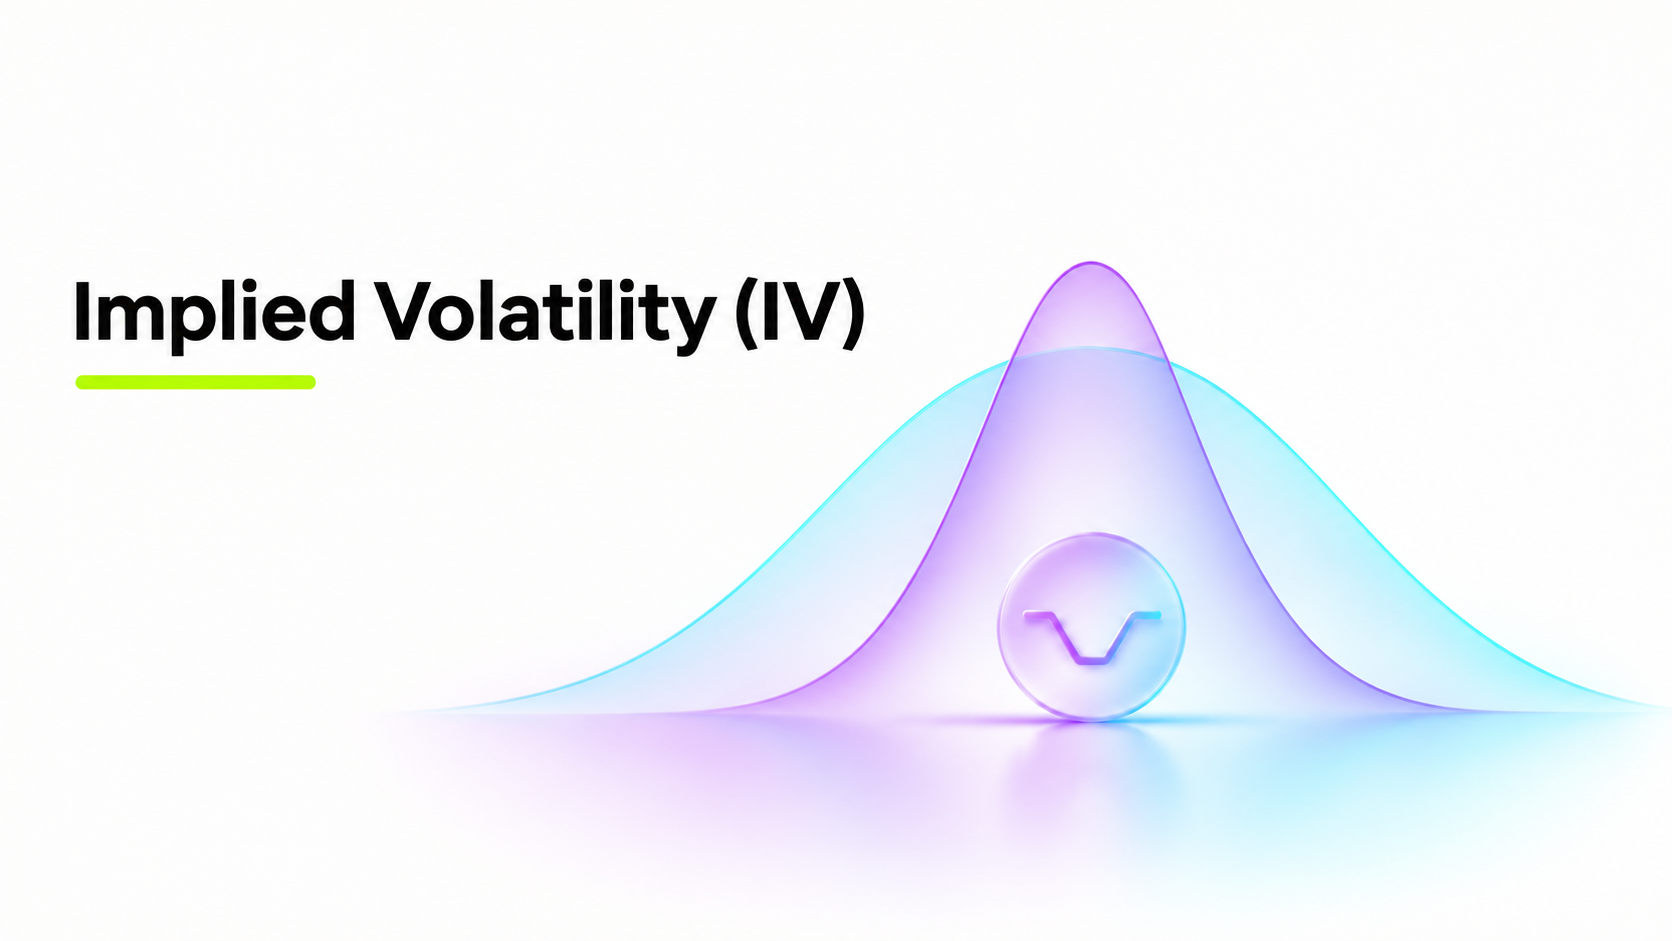
Implied volatility (IV) is a figure that indicates how volatile the underlying price is expected to be over the year. Traders can work backwards from observed option prices to derive this value.
Therefore, IV is not a forecast given by an exchange. It does not give us a prediction of where Nifty will go.
Suppose we have two call options with the same strike price, underlying price and expiration. If one option has a higher premium than the other, then generally, we can assume that the volatility implied by the pricing model is higher for this contract (assuming all other inputs are constant).
Traders may be paying more for an option if there is an expected policy change, company results or unexpected market movement. With greater expected volatility, the potential for a larger favourable price movement may also increase.
Interpreting IV
If Nifty is currently at 25,000 and has an implied volatility of 20% annually, this means that the annualised standard deviation assumed in pricing for this underlying is 20%. It does NOT mean that Nifty is expected to rise or fall by exactly 20%.
As an approximate value, over 30 days, a one-standard-deviation move would be:
20% × √(30 ÷ 365) ≈ 5.7%
At 25,000, this would be roughly ±1,430 points. This is purely theoretical and based on certain assumptions. We cannot be confident that Nifty will not move outside this range.
Furthermore, different strike prices and expiries may have different values of implied volatility. It is not necessarily the same across all options of a stock.
IV vs historical volatility
Historical volatility (often referred to as realised volatility) indicates how volatile the prices of an underlying asset have been over a period of time in the past. Implied volatility indicates what level of volatility is assumed in current option prices.
Key Difference
| Factor | Implied Volatility | Historical Volatility |
|---|---|---|
| Basis | Option prices | Historical price movements |
| Time frame | Future expectations | Past movements |
| Most commonly used for | Understanding option prices | Measuring realised volatility |
| Can change? | Throughout trading | When new data is observed |
Suppose there was very little movement in Nifty over the last month. Its historical volatility may be low. However, if there is an important RBI announcement coming up and traders expect greater price movement, then implied volatility may rise significantly, even with limited movement in historical volatility.
Alternatively, if Nifty had an extremely volatile month, realised volatility may be high. However, option prices may now reflect quieter expectations.
Neither historical nor implied volatility can guarantee an indication of price movement in the future. However, comparing both values can give traders an idea of what is priced in compared to what has recently occurred. Ensure you are comparing like-for-like time frames.
IV percentile and rank
Problem
Suppose we look at an option chain and see that the IV is 24%. Is this a high value?
Without additional context, it is difficult to determine. Depending on the underlying asset, 24% may be very high or may be typical.
To compare the current IV with historical values, traders may look at IV rank and IV percentile. Although these terms are similar, they are calculated differently.
IV Rank
IV Rank indicates where the current IV lies compared to the maximum and minimum IV in the specified time frame.
IV Rank = (Current IV − Minimum IV in Period) ÷ (Maximum IV in Period − Minimum IV in Period) × 100
Suppose, for example, the IV for the last year has ranged between 10% and 30%, and the current IV is 25%.
(25 − 10) ÷ (30 − 10) × 100 = 75
The IV Rank is 75. This means that the current IV is three-quarters of the way between the lowest and highest IV for the period. It does NOT mean that 75% of days in the period had lower IV.
IV Percentile
IV Percentile indicates the percentage of observations in the time frame with a value below the current IV value.
Suppose the current IV is 25%. If 80% of observations in the period had a lower value, then the IV Percentile is 80.
The key difference: IV Rank tells us the relative position of the current IV, whereas IV Percentile tells us how many observations fell below the current value.
If there was an extreme outlier, the IV Rank may be skewed. However, IV Percentile can give us a better insight into the distribution.
Different platforms may calculate this over different time frames and against different IV values. Be sure to understand how each figure is calculated.
IV crush
Suppose there is a major announcement expected tomorrow. Traders expect significant price movement, and so options appear expensive. You buy a call.
However, when the announcement occurs, the index increases only slightly. And your call premium falls.
Why?
If the uncertainty surrounding this announcement is suddenly removed, implied volatility could fall sharply. Traders refer to this as an IV crush.
Example
Suppose the call option has a premium of ₹150 and a Vega of ₹5 per one-percentage-point change in IV. If IV drops by 4 percentage points, the approximate effect on the option price is:
₹5 × 4 = ₹20 decrease
This could cause the option price to theoretically reduce to ₹130. However, other factors such as the underlying price, Delta, Gamma and time can also impact the price.
Even if you have correctly predicted the direction, you may be disappointed with the trade. The price movement may be too small to compensate for the loss in volatility and time value.
This is commonly seen around earnings announcements, the Union Budget, RBI decisions and other planned events, but it does not always occur.
India VIX link
India VIX is often referred to as a measure of market fear. However, it is slightly more specific in its calculation.
Published by NSE, India VIX is based on Nifty options. It indicates what the market expects Nifty volatility to be over the next 30 calendar days. It is expressed as an annualised percentage of volatility. NSE has adapted its calculations from Cboe’s volatility index methodology.
As a rule of thumb, increasing values of India VIX mean that more volatility is being priced into Nifty options. Decreasing values mean less expected volatility. However, we cannot determine the direction of movement in the index from this value.
Individual Options
If India VIX increases from 12 to 20, traders are pricing in significantly more expected volatility in Nifty. Assuming all other variables are constant, option premiums for Nifty may increase.
However, this is not the same value as the IV of individual Nifty calls or puts. Depending on the strike price, expiration and demand for options, individual values may differ.
In addition, values for stock options may behave differently.
Also, note that India VIX represents volatility over a 30-day time frame. If the option contract has a shorter expiration (weekly), India VIX should be considered more generally and should not be seen as a precise forecast of option premiums.
FAQs
What is a high IV?
This depends. Consider what the historical IV value has been for this underlying asset. Consider similar expiries and any upcoming events. Consider IV Rank and Percentile.
What is IV crush?
IV Crush is a sudden drop in IV. This often occurs after a significant anticipated event. This can cause option prices to decrease, even if the underlying moves in a favourable direction.
How does VIX affect options?
India VIX indicates expected volatility in Nifty. Generally, high values in India VIX mean that high volatility is assumed in index option prices. However, individual options will be impacted by strike price, expiration and other factors.
Should I buy options when IV is high?
High IV may mean that option prices are expensive relative to previous levels. Whether buying options is a good idea depends on expected movement, timing, the price of the contract and risk. High IV on its own is not a signal to buy options.
Conclusion
Sometimes, options can lose value despite the underlying price moving in the expected direction. Therefore, understanding implied volatility in options is important, along with Delta, Theta, strike price and expiration.
IV gives you an indication of expected volatility in the price of the underlying, as priced in the market. Historical volatility gives you an indication of what occurred previously. IV Rank and Percentile provide further context, and India VIX gives a general idea of expected volatility in Nifty.
Disclaimer
The stocks mentioned in this article are not recommendations. Please conduct your own research and due diligence before investing. Investment in securities market are subject to market risks, read all the related documents carefully before investing. Please read the Risk Disclosure documents carefully before investing in Equity Shares, Derivatives, Mutual fund, and/or other instruments traded on the Stock Exchanges. As investments are subject to market risks and price fluctuation risk, there is no assurance or guarantee that the investment objectives shall be achieved. Lemonn (Formerly known as NU Investors Technologies Pvt. Ltd) do not guarantee any assured returns on any investments. Past performance of securities/instruments is not indicative of their future performance.