How to Read an Option Chain: Complete Guide
 Written by Supratim Choudhury
 Reviewed by Gaurav Garg, SEBI-registered Research Analyst
Open an option chain, and you’ll find a table full of numbers. Strike prices, premiums, open interest, trading volumes, implied volatility and several other columns.
Some figures change every few seconds. Others remain unchanged for several minutes.
And for someone new to options trading, the entire table can look confusing. But don’t worry, we are going to help you understand those numbers in this blog!
Let’s get started.
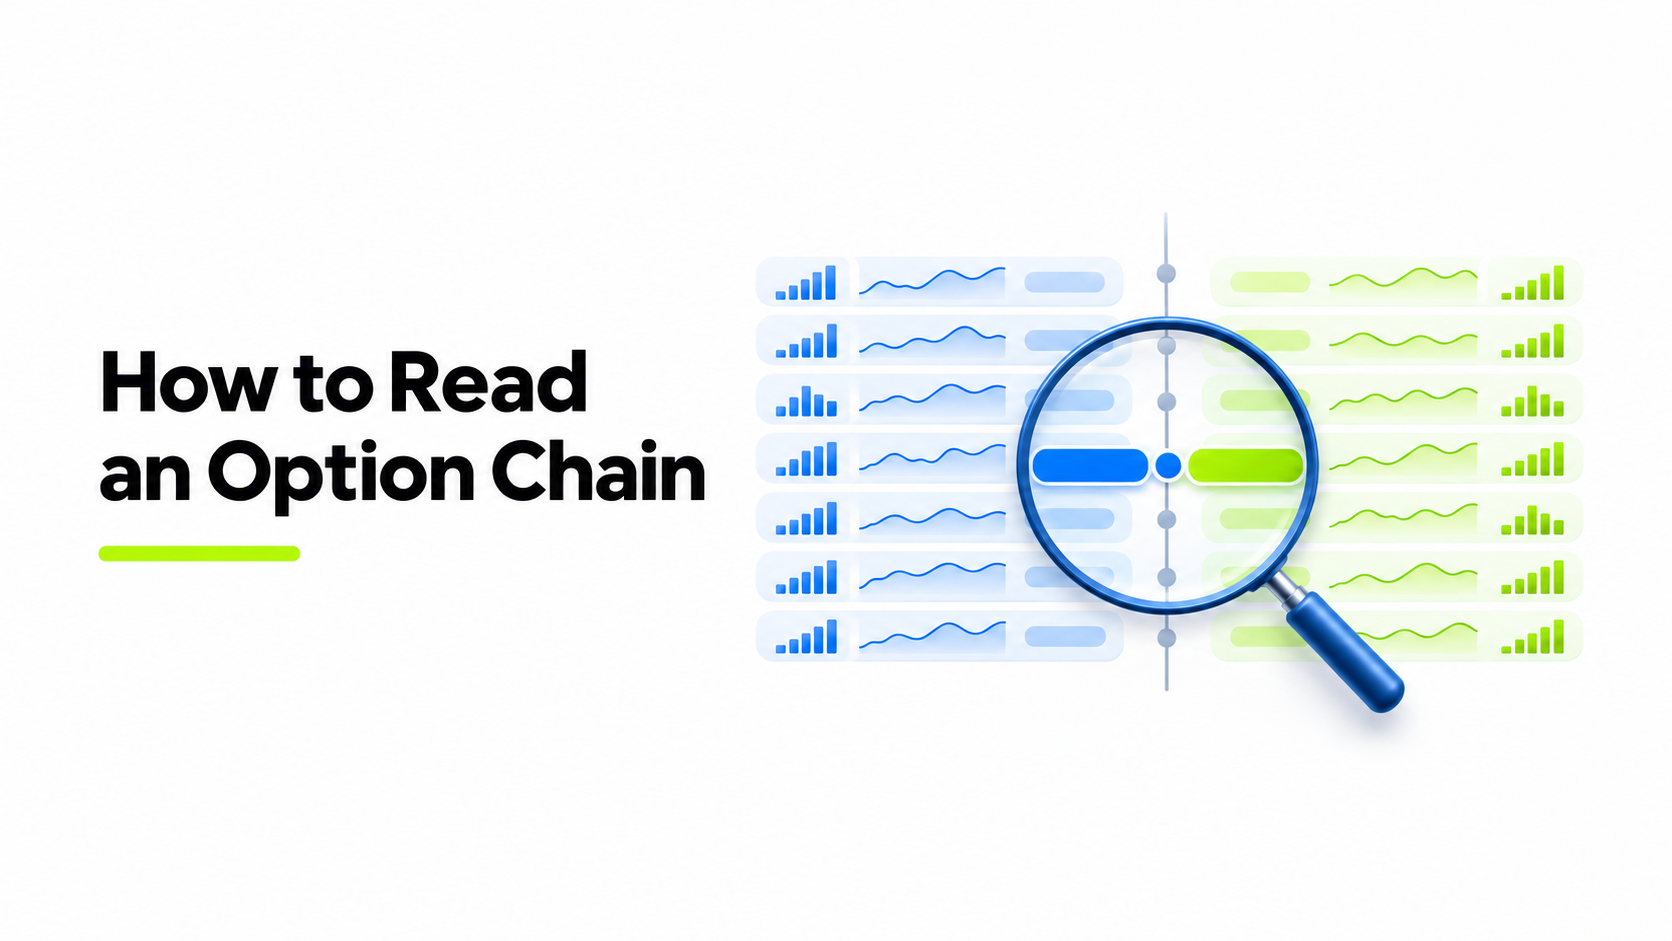
Option Chain Layout
An option chain may appear complicated at first. But look closely. There are three main sections.
Call options on the left. Strike prices in the middle. Put options on the right.
Each row displays the call and put contracts available at a particular strike price for the selected expiry.
Suppose Nifty trades at 25,000. The option chain may show strike prices such as 24,800, 24,900, 25,000, 25,100 and several others.
What Does an Option Chain Show?
| Call OI | Call Volume | Call LTP | Strike Price | Put LTP | Put Volume | Put OI |
|---|---|---|---|---|---|---|
| 12,500 | 8,200 | ₹260 | 24,800 | ₹65 | 12,400 | 65,000 |
| 18,000 | 11,500 | ₹190 | 24,900 | ₹95 | 15,200 | 52,000 |
| 35,000 | 25,000 | ₹130 | 25,000 | ₹135 | 28,000 | 42,000 |
| 52,000 | 31,000 | ₹85 | 25,100 | ₹185 | 19,500 | 25,000 |
Note: This is only a sample data table; actual option chain might vary based on the platform you use.
Now, a trader expecting Nifty to rise may examine calls. Someone expecting a decline may look at puts.
But selecting a contract involves more than choosing a direction.
The premium matters. So does the strike price, expiry and available liquidity.
Strike, LTP, OI, Change in OI
Four terms appear almost everywhere in an option chain.
Let’s understand what each one means.
Strike Price
The strike price is the predetermined price specified in an option contract.
Suppose Nifty trades at 25,000. You’ll see that calls and puts with the strikes of 24,900, 25,000 and 25,100.
The same underlying index but different contracts and premiums.
Last Traded Price (LTP)
LTP is the price at which an option contract last traded.
Suppose a Nifty call shows an LTP of ₹120.
That means its last traded premium was ₹120 per unit.
Now the current lot size of Nifty is 65 units. So the premium for one lot of Nifty would be:
₹120 × 65 = ₹7,800
Note: The actual executed price will depend on charges and platform.
Open Interest (OI)
Now comes one of the most important figures.
Open interest tells us how many option contracts are still pending to be executed.
Let’s say the 25,000 call has an OI of 50,000 contracts.
This means 50,000 contracts remain open at that particular strike and expiry.
But here’s something worth remembering.
Every option contract has a buyer and a seller.
So, high OI alone doesn’t tell you whether the market will rise or fall.
Change in OI
Change in OI measures the increase or decrease in outstanding contracts.
For example:
- Previous OI: 40,000 contracts
- Current OI: 50,000 contracts
- Change in OI: +10,000 contracts
More contracts are now open.
A negative change indicates that outstanding positions have declined.
And volume?
Volume counts contracts traded during a period. OI counts contracts that remain open.
A contract can trade multiple times without creating an equal increase in OI.
Implied Volatility
Suppose Nifty trades at 25,000.
A major economic announcement is due tomorrow. Traders expect considerable price movement. Now option premiums begin to rise. Why would that happen when Nifty hasn’t moved much?
One possible reason is implied volatility, commonly called IV.
IV represents the volatility estimate reflected in an option’s market price. It’s generally expressed on an annualised basis.
How Does IV Affect Premiums?
Higher IV generally increases option premiums, all else equal.
Lower IV generally reduces them.
Let’s say a trader buys a call option before an important announcement.
The announcement comes out. Nifty rises slightly.
Sounds favourable for the call buyer?
Possibly. But the option’s premium may still fall if implied volatility drops sharply.
Traders call this a volatility crush.
Things to Remember About IV
- Higher IV generally means higher option premiums.
- Lower IV generally means lower premiums.
- IV reflects the expected magnitude of price movements.
- It doesn’t tell traders which direction the market will take.
Also, IV changes with market conditions. The figure you see now may be different a few minutes later.
ITM/ATM/OTM
These are the three abbreviations you’ll see frequently in options trading.
They describe where an option’s strike price stands relative to the underlying market price.
Let’s use Nifty at 25,000.
In the Money (ITM)
An option is ITM when it has positive intrinsic value. A 24,900 call is ITM because its strike price is below Nifty’s current level. A 25,100 put is also ITM.
At the Money (ATM)
An ATM option has a strike price equal to or closest to the current market level. With Nifty at 25,000, the 25,000 strike is ATM.
Out of the Money (OTM)
An OTM option has no intrinsic value.
For example:
- A 25,100 call is OTM.
- A 24,900 put is OTM.
Quick Comparison
| Strike Price | Call Option | Put Option |
|---|---|---|
| 24,900 | ITM | OTM |
| 25,000 | ATM | ATM |
| 25,100 | OTM | ITM |
One important detail.
An ITM option doesn’t automatically mean the trade is profitable.
The premium paid and the current option value determine the actual outcome.
Spotting Support and Resistance with OI
Here’s where option chains become particularly interesting.
Traders often examine open interest at different strikes to identify possible support and resistance areas.
How?
By looking at where outstanding option positions are concentrated.
Finding Possible Resistance
Suppose Nifty trades at 25,000.
The 25,200 call strike has unusually high OI.
Some traders may identify 25,200 as a possible resistance area, especially if other data suggest fresh call writing.
But high call OI alone doesn’t prove sellers will defend that level.
Finding Possible Support
Now suppose the 24,800 put has substantial OI.
Traders may examine 24,800 as possible support.
The reasoning is similar. A concentration of put positions may indicate an area that market participants consider important.
A Practical Example
| Strike Price | Call OI | Put OI |
|---|---|---|
| 24,800 | 12,000 | 65,000 |
| 25,000 | 35,000 | 42,000 |
| 25,200 | 70,000 | 15,000 |
Note: Hypothetical figures
Notice the difference?
Put OI is highest at 24,800. Call OI is highest at 25,200.
A trader might watch these two levels.
But will Nifty remain between them?
There’s no guarantee.
Large positions can disappear within minutes. New positions can appear at different strikes. And one unexpected announcement may change everything.
OI helps traders examine positioning. It cannot confirm future price movements.
Put-Call Ratio
Now imagine examining the entire option chain.
Thousands of put contracts. Thousands of call contracts.
How do you compare their overall activity?
One commonly used measure is the Put-Call Ratio, or PCR.
How Is PCR Calculated?
For an OI-based PCR:
PCR = Total Put OI ÷ Total Call OI
Let’s take an example.
- Total Put OI: 12 lakh contracts
- Total Call OI: 10 lakh contracts
PCR = 12 ÷ 10 = 1.2
That means outstanding put contracts exceed outstanding call contracts.
How to Read PCR
| PCR | What It Indicates |
|---|---|
| Above 1 | Put OI exceeds call OI |
| Equal to 1 | Put and call OI are equal |
| Below 1 | Call OI exceeds put OI |
Simple calculation.
But interpretation? That’s where traders need to be careful.
A high PCR doesn’t guarantee a market rally. Put positions may represent hedging, buying or selling activity.
Similarly, a low PCR doesn’t automatically indicate a decline.
There is also a volume-based PCR.
It compares traded put volume with traded call volume, so the result may differ from an OI-based PCR.
Always check which measure your platform displays.
FAQs
What does OI mean in the option chain?
OI means Open Interest. It shows the number of outstanding option contracts that haven’t been closed or expired.
How to find support from the option chain?
Traders examine strikes with high put OI and other supporting data to identify possible support areas. These levels can fail.
What is PCR?
PCR stands for Put-Call Ratio. The OI-based PCR divides total put open interest by total call open interest.
What is IV?
IV stands for Implied Volatility. It represents the volatility estimate reflected in an option’s market price and affects its premium.
Conclusion
An option chain displays important information about available call and put contracts. Strike prices. Premiums. OI. IV. Volume. Each figure serves a purpose.
Open interest shows outstanding positions. Implied volatility helps traders understand option pricing. PCR compares put and call activity. And ITM, ATM and OTM indicate how strikes relate to the current market price.
We hope this blog has offered you enough information on call and put options. If you are looking to kick-off option trading, Lemonn offers the best platform for the same.
So don’t forget to check out our platform today.
Disclaimer
The stocks mentioned in this article are not recommendations. Please conduct your own research and due diligence before investing. Investment in securities market are subject to market risks, read all the related documents carefully before investing. Please read the Risk Disclosure documents carefully before investing in Equity Shares, Derivatives, Mutual fund, and/or other instruments traded on the Stock Exchanges. As investments are subject to market risks and price fluctuation risk, there is no assurance or guarantee that the investment objectives shall be achieved. Lemonn (Formerly known as NU Investors Technologies Pvt. Ltd) do not guarantee any assured returns on any investments. Past performance of securities/instruments is not indicative of their future performance.